
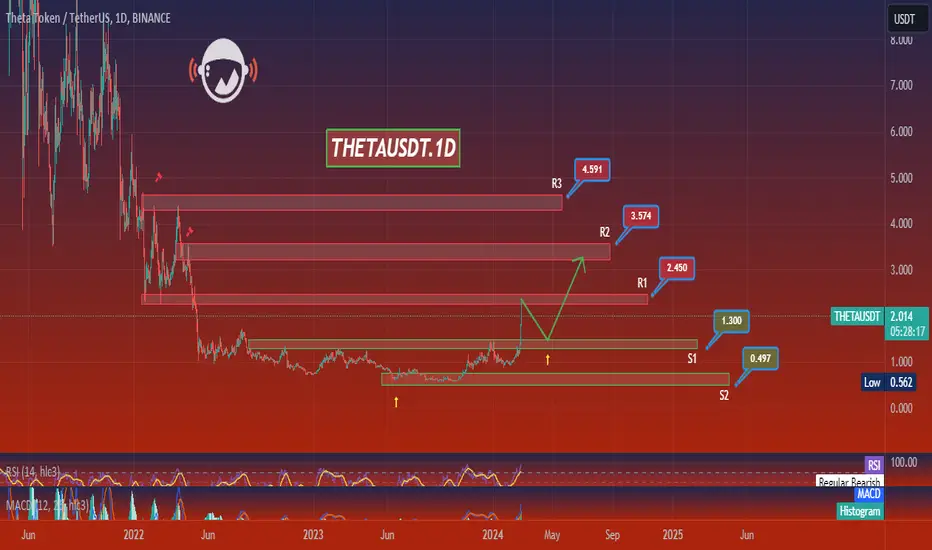
Based on the given market data, the THETA cryptocurrency is currently priced at $2.031 in the USDT market. The Relative Strength Index (RSI) for the 4-hour, 1-day, and 7-day periods are 92.67, 93.77, and 77.60 respectively. The high RSI values suggest that the cryptocurrency is currently overbought, indicating a potential price correction.
The Moving Average Convergence Divergence (MACD) for the 4-hour, 1-day, and 7-day periods are 0.214, 0.156, and 0.148 respectively. These values suggest a bullish trend in the short term. The Bollinger Bands (BB) for the same periods are 2.189, 2.189, and 2.190 respectively, which also indicates a potential price volatility.
The support levels for the 4-hour period are $1.882, $1.593, and $1.112, while the resistance levels are $2.316, $2.500, and $2.850. For the 1-day period, the support levels are $1.800, $1.480, and $1.120, while the resistance levels are $2.337, $3.026, and $3.200. For the 7-day period, the support levels are $1.092, $0.540, and $0.504, while the resistance levels are $2.490, $3.300, and $3.500.
Based on these indicators, THETA is currently in a bullish trend but may experience a potential price correction due to the high RSI values. Therefore, it may be advisable for traders to watch the market closely before making any decisions. Please note that cryptocurrency investments carry a high level of risk and it's advisable to only invest what you can afford to lose. As always, it's recommended to do your own research or consult with a financial advisor.
The Moving Average Convergence Divergence (MACD) for the 4-hour, 1-day, and 7-day periods are 0.214, 0.156, and 0.148 respectively. These values suggest a bullish trend in the short term. The Bollinger Bands (BB) for the same periods are 2.189, 2.189, and 2.190 respectively, which also indicates a potential price volatility.
The support levels for the 4-hour period are $1.882, $1.593, and $1.112, while the resistance levels are $2.316, $2.500, and $2.850. For the 1-day period, the support levels are $1.800, $1.480, and $1.120, while the resistance levels are $2.337, $3.026, and $3.200. For the 7-day period, the support levels are $1.092, $0.540, and $0.504, while the resistance levels are $2.490, $3.300, and $3.500.
Based on these indicators, THETA is currently in a bullish trend but may experience a potential price correction due to the high RSI values. Therefore, it may be advisable for traders to watch the market closely before making any decisions. Please note that cryptocurrency investments carry a high level of risk and it's advisable to only invest what you can afford to lose. As always, it's recommended to do your own research or consult with a financial advisor.

免責聲明
這些資訊和出版物並非旨在提供,也不構成TradingView提供或認可的任何形式的財務、投資、交易或其他類型的建議或推薦。請閱讀使用條款以了解更多資訊。
免責聲明
這些資訊和出版物並非旨在提供,也不構成TradingView提供或認可的任何形式的財務、投資、交易或其他類型的建議或推薦。請閱讀使用條款以了解更多資訊。