
Fundamental Price / Fundamental Data
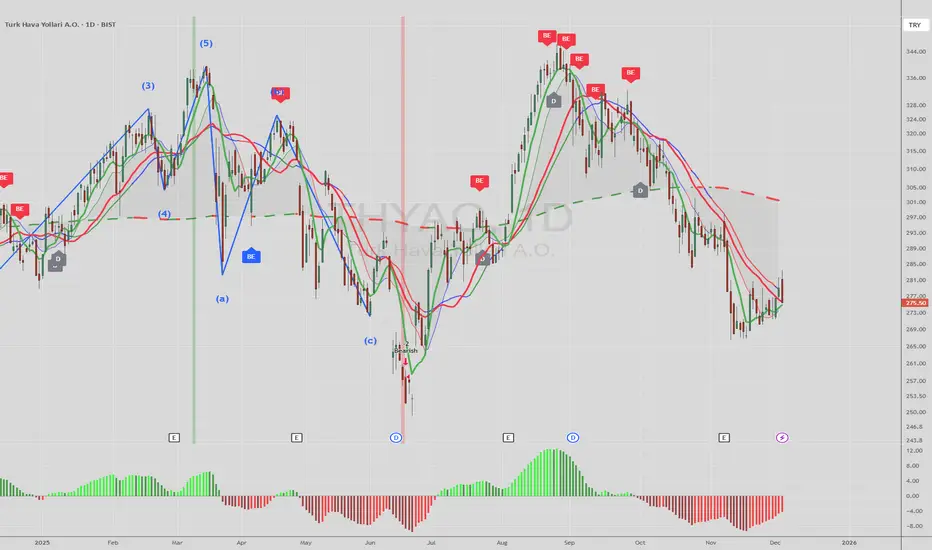
Today’s price: approximately ₺275.50 – ₺279.00 range.
52-week range: ₺249.20 (low) – ₺346.25 (high)
The Price/Earnings (P/E) and Market Value/Book Value (P/B) ratios appear relatively discounted compared to current price levels.
Technical Outlook – Short Term
The price is at the 50-day moving average level, which is a threshold that can technically signal a potential “Buy.”
In the short term, THYAO seems to have found technical support around current levels — this increases the probability of short-term rebound buying. However, some indicators and moving averages remain cautious, which may prevent the price from finding a clear direction.
Some analyses suggest significantly higher target price levels for the stock — for example, ₺478–₺575 range.
Summary
THYAO may be suitable for medium / long-term accumulation, as the price still appears undervalued compared to historical levels, with potential upside.
In the short term, it can be monitored for reaction moves, especially the ₺275–₺280 level, which could act as support — if the price holds this band, a rebound may occur.
Not investment advice (NIA).
Today’s price: approximately ₺275.50 – ₺279.00 range.
52-week range: ₺249.20 (low) – ₺346.25 (high)
The Price/Earnings (P/E) and Market Value/Book Value (P/B) ratios appear relatively discounted compared to current price levels.
Technical Outlook – Short Term
The price is at the 50-day moving average level, which is a threshold that can technically signal a potential “Buy.”
In the short term, THYAO seems to have found technical support around current levels — this increases the probability of short-term rebound buying. However, some indicators and moving averages remain cautious, which may prevent the price from finding a clear direction.
Some analyses suggest significantly higher target price levels for the stock — for example, ₺478–₺575 range.
Summary
THYAO may be suitable for medium / long-term accumulation, as the price still appears undervalued compared to historical levels, with potential upside.
In the short term, it can be monitored for reaction moves, especially the ₺275–₺280 level, which could act as support — if the price holds this band, a rebound may occur.
Not investment advice (NIA).

免責聲明
這些資訊和出版物並非旨在提供,也不構成TradingView提供或認可的任何形式的財務、投資、交易或其他類型的建議或推薦。請閱讀使用條款以了解更多資訊。
免責聲明
這些資訊和出版物並非旨在提供,也不構成TradingView提供或認可的任何形式的財務、投資、交易或其他類型的建議或推薦。請閱讀使用條款以了解更多資訊。