
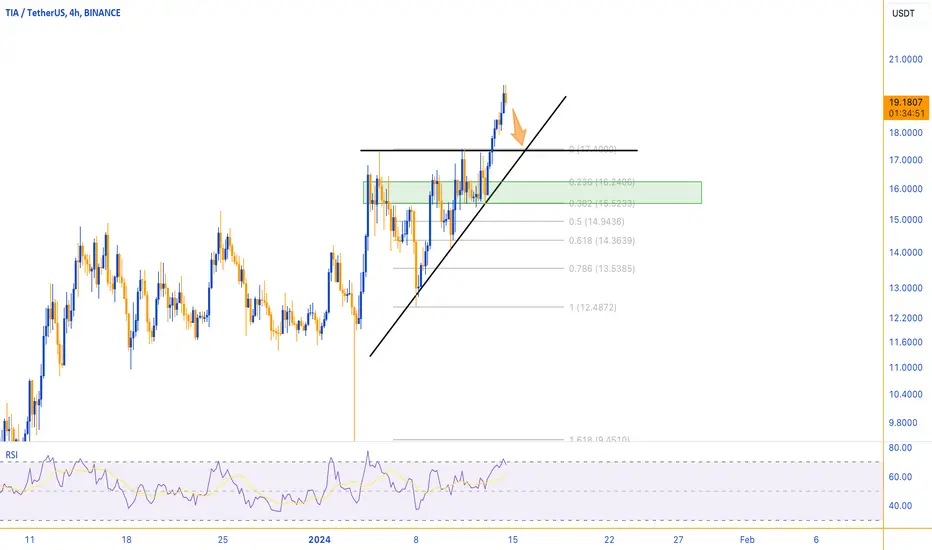
• As observed, there has been a recent development on the 4-hour TIA chart, indicating the formation of a triangle.
• In the last few candles, a breakout has occurred through the triangle's upper boundary.
• It is important to note, however, that the consolidating candles are not yet formed.
• Therefore, it is reasonable to expect a pullback in this vicinity.
• Following the pullback, a continuation of the upward price movement is anticipated.
(All analyses will be updated)
This analysis is informational, not financial advice.
• In the last few candles, a breakout has occurred through the triangle's upper boundary.
• It is important to note, however, that the consolidating candles are not yet formed.
• Therefore, it is reasonable to expect a pullback in this vicinity.
• Following the pullback, a continuation of the upward price movement is anticipated.
(All analyses will be updated)
This analysis is informational, not financial advice.

Join the free Telegram channel
💎 Telegram Channel: t.me/MonoCoin_Public
🔔 Bot: t.me/MonoCoinSignal_Bot?start=starter_tv
🌐 Website: MonoCoin.net
⭐️ 5-Star TrustPilot: trustpilot.com/review/monocoin.net
💎 Telegram Channel: t.me/MonoCoin_Public
🔔 Bot: t.me/MonoCoinSignal_Bot?start=starter_tv
🌐 Website: MonoCoin.net
⭐️ 5-Star TrustPilot: trustpilot.com/review/monocoin.net
免責聲明
這些資訊和出版物並非旨在提供,也不構成TradingView提供或認可的任何形式的財務、投資、交易或其他類型的建議或推薦。請閱讀使用條款以了解更多資訊。
Join the free Telegram channel
💎 Telegram Channel: t.me/MonoCoin_Public
🔔 Bot: t.me/MonoCoinSignal_Bot?start=starter_tv
🌐 Website: MonoCoin.net
⭐️ 5-Star TrustPilot: trustpilot.com/review/monocoin.net
💎 Telegram Channel: t.me/MonoCoin_Public
🔔 Bot: t.me/MonoCoinSignal_Bot?start=starter_tv
🌐 Website: MonoCoin.net
⭐️ 5-Star TrustPilot: trustpilot.com/review/monocoin.net
免責聲明
這些資訊和出版物並非旨在提供,也不構成TradingView提供或認可的任何形式的財務、投資、交易或其他類型的建議或推薦。請閱讀使用條款以了解更多資訊。