
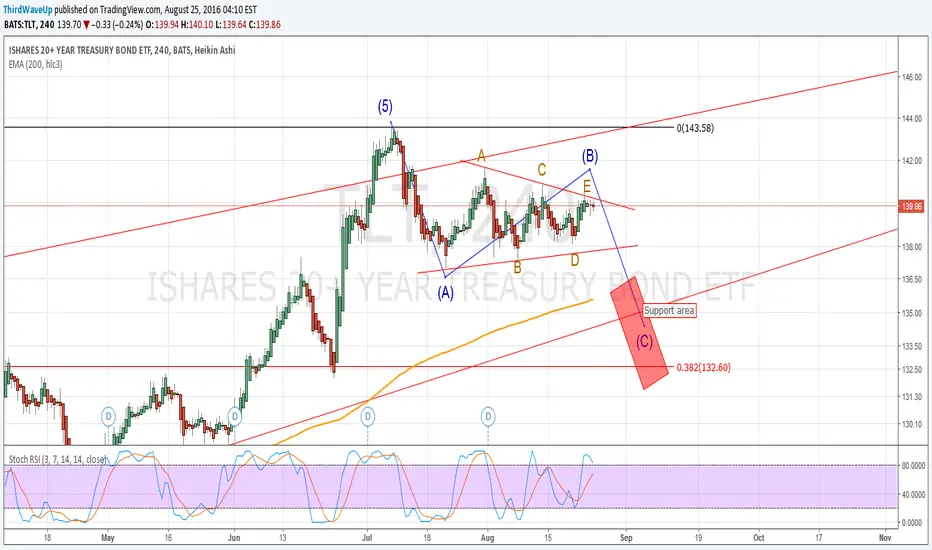
If the triangle plays out and TLT swings lower, the red area is where I will be looking the first signs of support. We have 200 mA, a support line and a fib level in this area. A break above 141.72 would invalidate the triangle count.
註釋
註釋
Possible swing change here with Heiken bars changing color. However the break below the support and MA has me skeptical.註釋
We've seen some strong, green Heiken Ashi bars upwards. The last few had no bottom shadows indicating a strong up trend. However, the bars are getting smaller as it tests the resistance line. And we're still hovering about a 200 mA with RSI on the overbought side. I'm not discounting a continuation of the down trend. But I did take a small, long TLT position this week - I'm not making a trade suggestion for anyone.註釋
The break below the previous low discounts a 1st wave up, according to Elliott's rules. It will be interesting to see what happens next, but I am considering a double zig-zag correction or possibly a leading diagonal down. The later case suggests a reversal in trend. I am maintaining my long position for now and perhaps will get out on a bounce up. I am not making any trade recommendations.
免責聲明
這些資訊和出版物並非旨在提供,也不構成TradingView提供或認可的任何形式的財務、投資、交易或其他類型的建議或推薦。請閱讀使用條款以了解更多資訊。
免責聲明
這些資訊和出版物並非旨在提供,也不構成TradingView提供或認可的任何形式的財務、投資、交易或其他類型的建議或推薦。請閱讀使用條款以了解更多資訊。