
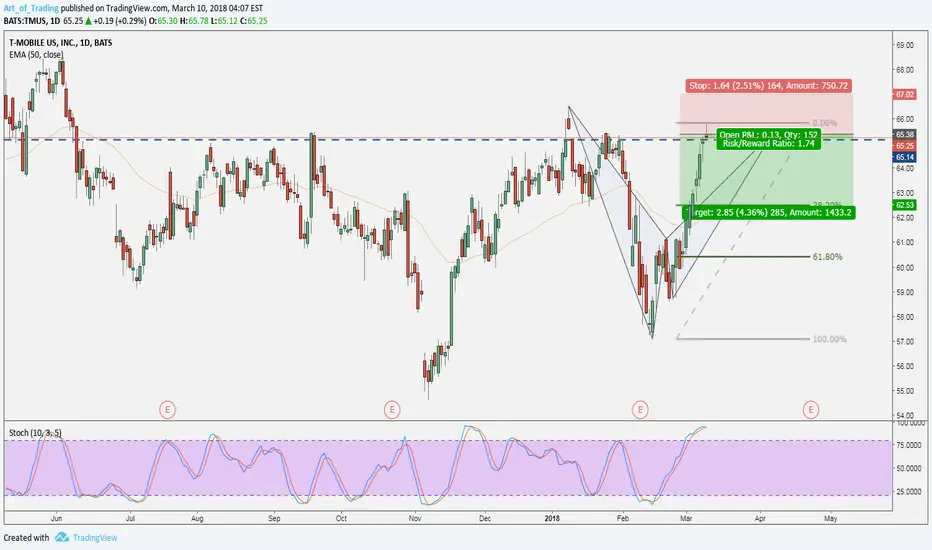
The TMUS price increased significantly last few days and it reached the resistance area at 65.14. The price respected that level few times already and it is more likely that it will do it again. Moreover, the price action formed the shooting start candlestick bar, which is considered as a reversal pattern. It means, there is a shift from buying to selling. The bears are going to sell sometime soon and it is the best area to do so.
In addition, TMUS formed a bat pattern, which increases the probability of this setup and provides the entry and exit points. Plus, nice risk/reward ratio.
T1- 38.2%
T2 – 61.8%
- Follow & Comment -
In addition, TMUS formed a bat pattern, which increases the probability of this setup and provides the entry and exit points. Plus, nice risk/reward ratio.
T1- 38.2%
T2 – 61.8%
- Follow & Comment -

免責聲明
這些資訊和出版物並非旨在提供,也不構成TradingView提供或認可的任何形式的財務、投資、交易或其他類型的建議或推薦。請閱讀使用條款以了解更多資訊。
免責聲明
這些資訊和出版物並非旨在提供,也不構成TradingView提供或認可的任何形式的財務、投資、交易或其他類型的建議或推薦。請閱讀使用條款以了解更多資訊。