
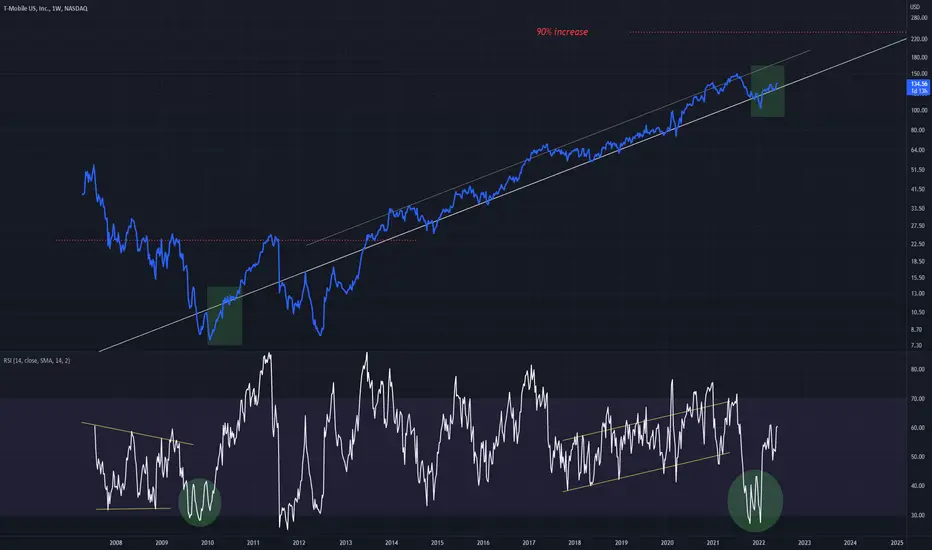
Similar structural patterns can be seen on both chart and RSI at green circle locations
In the first situation a 90% rise was seen on this Weekly chart
The second situation shows an RSI that is comparable
90% rise again?
In the first situation a 90% rise was seen on this Weekly chart
The second situation shows an RSI that is comparable
90% rise again?

免責聲明
這些資訊和出版物並非旨在提供,也不構成TradingView提供或認可的任何形式的財務、投資、交易或其他類型的建議或推薦。請閱讀使用條款以了解更多資訊。