
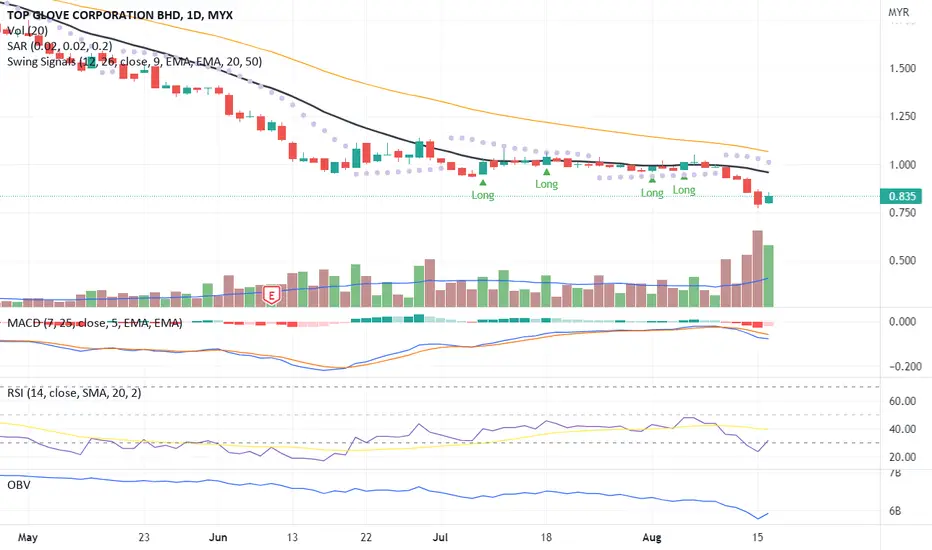
The candlestick indicates a low price momentum compared with the T-2 candlestick with the price closed above the opening price. Hence, the candlestick indicates a divergence signal where high volume momentum; crosses above the MA20 line.
MACD and OBV indicators indicate a divergence signal and confirm the price candlestick towards the MA20 line.
The price Point of Control (POC) of 0.840 will be a price resistance for today trading. If the price closed above 0.840 or 0.865then it will begin a price uptrend towards the MA20 line as new resistance.
To place a bid, use VWAP as a guideline and place the bid below the VWAP line or POC.
Let's save TOPGLOV in WL and watch out for significant price movement towards the next price resistance.
R 0.840, 0.865
S 0.795
MACD and OBV indicators indicate a divergence signal and confirm the price candlestick towards the MA20 line.
The price Point of Control (POC) of 0.840 will be a price resistance for today trading. If the price closed above 0.840 or 0.865then it will begin a price uptrend towards the MA20 line as new resistance.
To place a bid, use VWAP as a guideline and place the bid below the VWAP line or POC.
Let's save TOPGLOV in WL and watch out for significant price movement towards the next price resistance.
R 0.840, 0.865
S 0.795

免責聲明
這些資訊和出版物並非旨在提供,也不構成TradingView提供或認可的任何形式的財務、投資、交易或其他類型的建議或推薦。請閱讀使用條款以了解更多資訊。
免責聲明
這些資訊和出版物並非旨在提供,也不構成TradingView提供或認可的任何形式的財務、投資、交易或其他類型的建議或推薦。請閱讀使用條款以了解更多資訊。