
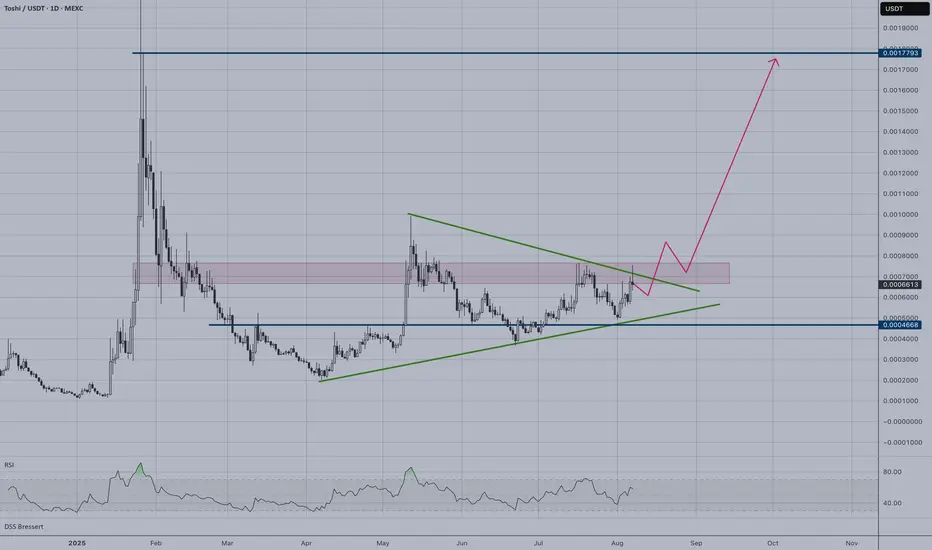
TOSHI is forming a classic symmetrical triangle pattern on the daily timeframe, indicating consolidation before a potential major move. The price has been compressed between converging support and resistance lines for several months.
Key Technical Observations:
Triangle pattern nearing apex completion
RSI shows neutral momentum around 50 level
Volume compression typical of triangle formations
Breakout Scenarios:
Bullish Breakout:
Target: 0.0017793 USDT (upper resistance zone)
Entry: Above triangle resistance with volume confirmation
Bearish Breakdown:
Target: 0.0004668 USDT (lower support zone)
Stop-loss consideration above breakdown level
Risk Management:
The triangle is in its final stages, making this a high-probability setup. However, false breakouts are common, so waiting for volume confirmation and a clean break of either trendline is crucial. The projected path suggests bullish bias, but traders should prepare for movement in either direction.
Key Technical Observations:
Triangle pattern nearing apex completion
RSI shows neutral momentum around 50 level
Volume compression typical of triangle formations
Breakout Scenarios:
Bullish Breakout:
Target: 0.0017793 USDT (upper resistance zone)
Entry: Above triangle resistance with volume confirmation
Bearish Breakdown:
Target: 0.0004668 USDT (lower support zone)
Stop-loss consideration above breakdown level
Risk Management:
The triangle is in its final stages, making this a high-probability setup. However, false breakouts are common, so waiting for volume confirmation and a clean break of either trendline is crucial. The projected path suggests bullish bias, but traders should prepare for movement in either direction.

Find top crypto tokens with sector indices, AI-powered sentiment analysis & news summaries.
tokenradar.ai/tv
tokenradar.ai/tv
免責聲明
這些資訊和出版物並非旨在提供,也不構成TradingView提供或認可的任何形式的財務、投資、交易或其他類型的建議或推薦。請閱讀使用條款以了解更多資訊。
Find top crypto tokens with sector indices, AI-powered sentiment analysis & news summaries.
tokenradar.ai/tv
tokenradar.ai/tv
免責聲明
這些資訊和出版物並非旨在提供,也不構成TradingView提供或認可的任何形式的財務、投資、交易或其他類型的建議或推薦。請閱讀使用條款以了解更多資訊。