
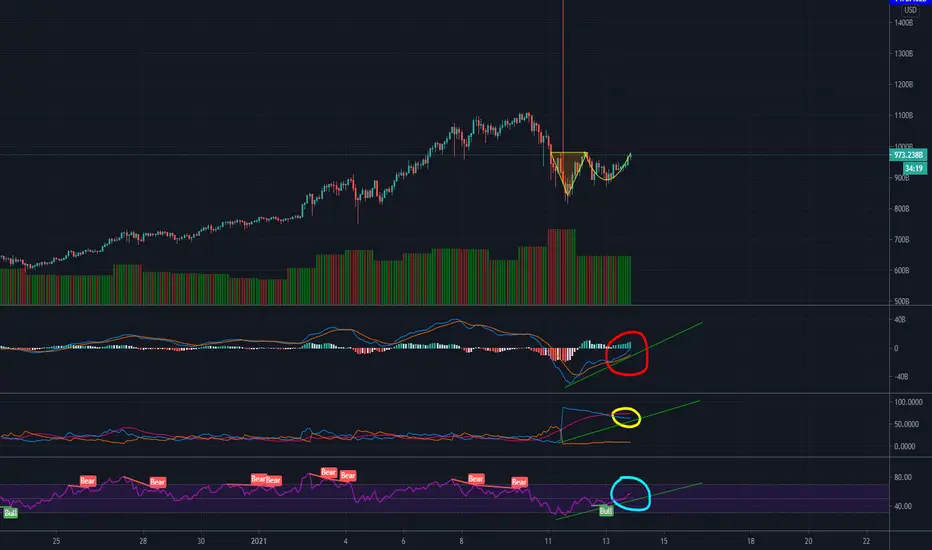
Total Market Cap A&E Bottom
Here in the 2Hr chart we have an Adam & Eve Bottom formation.
As you can see in the MACD below price circled in red there is a looming cross into bullish territory. You can see the upward trend here as well.
Below that in the DMI Directional Movement Index circled in yellow highlights the fact the the positive buying pressure ( blue line ) is in a strong trend @ 73 indicated by the red line.
The RSI in the bottom also is in a uptrend. It sits at 58 ATM. 70 and above is considered bullish.
There is also an inverted hammer that stretches' up to the sky
Here in the 2Hr chart we have an Adam & Eve Bottom formation.
As you can see in the MACD below price circled in red there is a looming cross into bullish territory. You can see the upward trend here as well.
Below that in the DMI Directional Movement Index circled in yellow highlights the fact the the positive buying pressure ( blue line ) is in a strong trend @ 73 indicated by the red line.
The RSI in the bottom also is in a uptrend. It sits at 58 ATM. 70 and above is considered bullish.
There is also an inverted hammer that stretches' up to the sky

免責聲明
這些資訊和出版物並非旨在提供,也不構成TradingView提供或認可的任何形式的財務、投資、交易或其他類型的建議或推薦。請閱讀使用條款以了解更多資訊。
免責聲明
這些資訊和出版物並非旨在提供,也不構成TradingView提供或認可的任何形式的財務、投資、交易或其他類型的建議或推薦。請閱讀使用條款以了解更多資訊。