
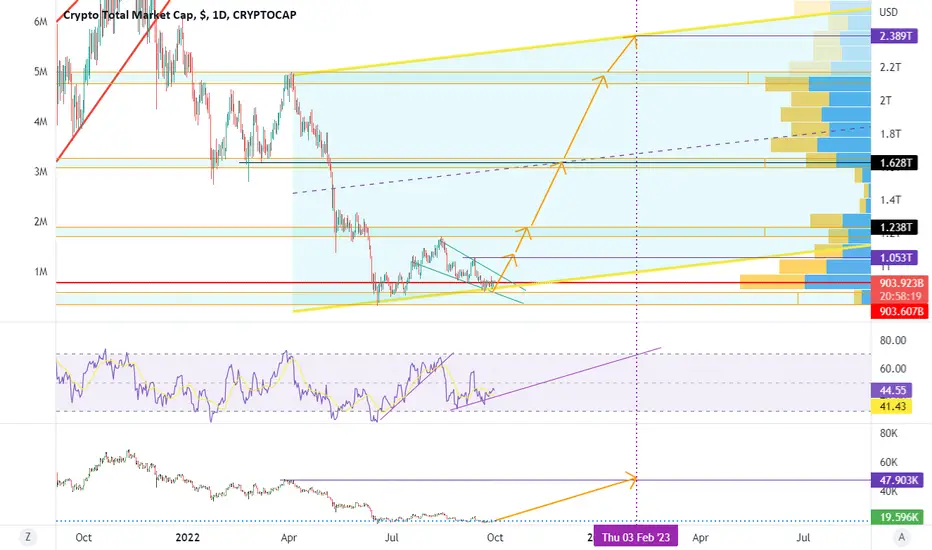
The total market cap has double bottomed on the daily reflecting a possible change in long term trend. Currently the index is within a falling wedge and will probably breakout upward.
The RSI paints heavy bullish divergence and is uptrending.
Upward break of falling wedge will raise the market cap to 1.05 trillion.
Arrows indicate possible target if bull trend is maintained.
A real double bottom will bring the index to 2 trillion, the same level as the start of April. The price of BTC at the start of April was 48.5k.
The RSI paints heavy bullish divergence and is uptrending.
Upward break of falling wedge will raise the market cap to 1.05 trillion.
Arrows indicate possible target if bull trend is maintained.
A real double bottom will bring the index to 2 trillion, the same level as the start of April. The price of BTC at the start of April was 48.5k.

免責聲明
這些資訊和出版物並非旨在提供,也不構成TradingView提供或認可的任何形式的財務、投資、交易或其他類型的建議或推薦。請閱讀使用條款以了解更多資訊。