
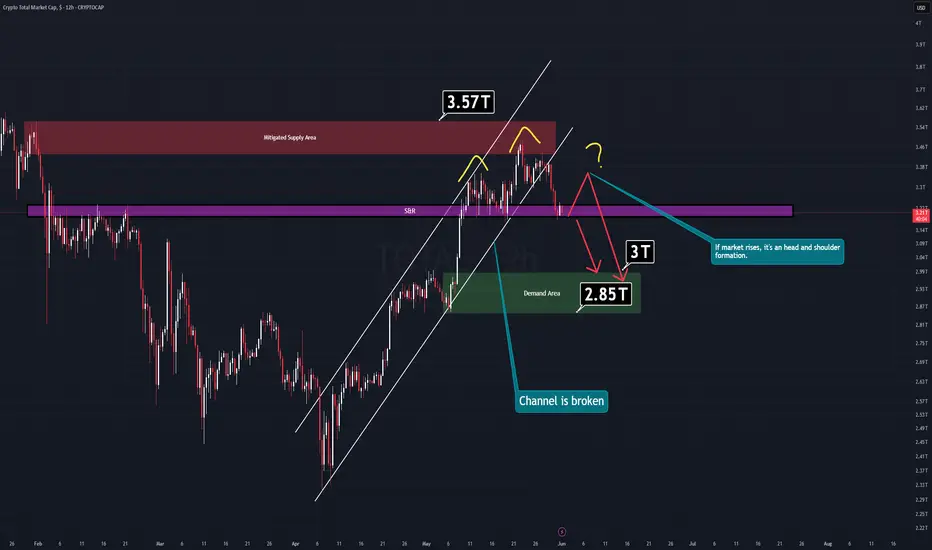
Red candles may be approaching for the TOTAL market cap parameter.
Currently, TOTAL is sitting right on a strong support zone that has held multiple times in the past. However, if this level fails to hold, the market could experience a sharp decline in the coming days.
Two Possible Scenarios:
Bullish case: If the market manages a bounce this week, there’s a risk of forming a Head and Shoulders pattern, which could act as a reversal structure unless invalidated quickly.
Bearish case: TOTAL has already mitigated a key supply zone (marked in red on the chart). A logical move here would be a retracement down to a nearby demand zone to regain strength for a fresh upward push.
If the current support is lost, we can expect a drop toward the green demand area between 3T and 2.85T.
Opportunity Zone: This range (3T–2.85T) will be ideal for long-term long or buy positions once reached, as it represents a high-probability rebound zone based on historical price behavior.
— Thanks for reading.
Currently, TOTAL is sitting right on a strong support zone that has held multiple times in the past. However, if this level fails to hold, the market could experience a sharp decline in the coming days.
Two Possible Scenarios:
Bullish case: If the market manages a bounce this week, there’s a risk of forming a Head and Shoulders pattern, which could act as a reversal structure unless invalidated quickly.
Bearish case: TOTAL has already mitigated a key supply zone (marked in red on the chart). A logical move here would be a retracement down to a nearby demand zone to regain strength for a fresh upward push.
If the current support is lost, we can expect a drop toward the green demand area between 3T and 2.85T.
Opportunity Zone: This range (3T–2.85T) will be ideal for long-term long or buy positions once reached, as it represents a high-probability rebound zone based on historical price behavior.
— Thanks for reading.

免責聲明
這些資訊和出版物並非旨在提供,也不構成TradingView提供或認可的任何形式的財務、投資、交易或其他類型的建議或推薦。請閱讀使用條款以了解更多資訊。