
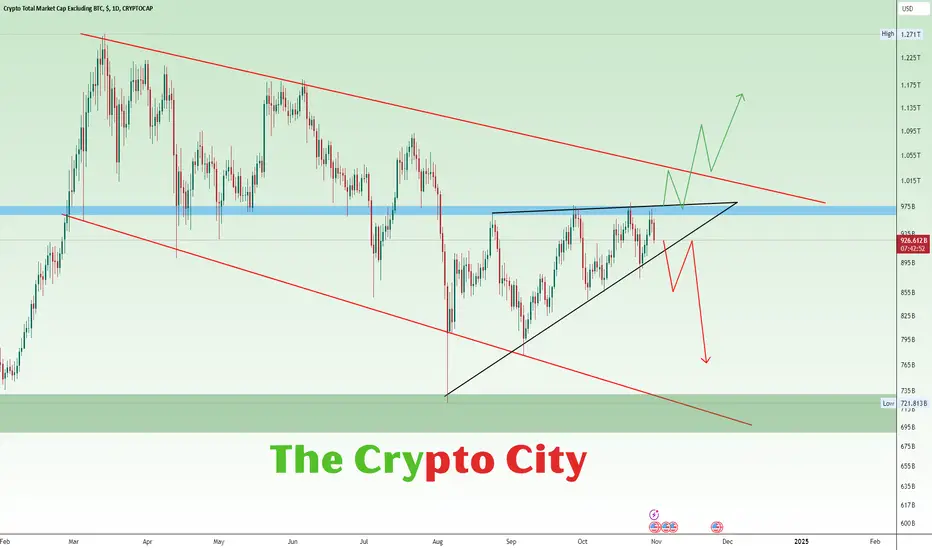
This chart of the total crypto market cap (excluding BTC) shows a symmetrical triangle pattern within a broader descending wedge. Price is near the triangle’s upper resistance, suggesting a potential breakout or breakdown. The Blue resistance zone is very important to flip for bullish moves.
Everything is on the chart
Everything is on the chart

免責聲明
這些資訊和出版物並非旨在提供,也不構成TradingView提供或認可的任何形式的財務、投資、交易或其他類型的建議或推薦。請閱讀使用條款以了解更多資訊。
免責聲明
這些資訊和出版物並非旨在提供,也不構成TradingView提供或認可的任何形式的財務、投資、交易或其他類型的建議或推薦。請閱讀使用條款以了解更多資訊。