 TOTAL3
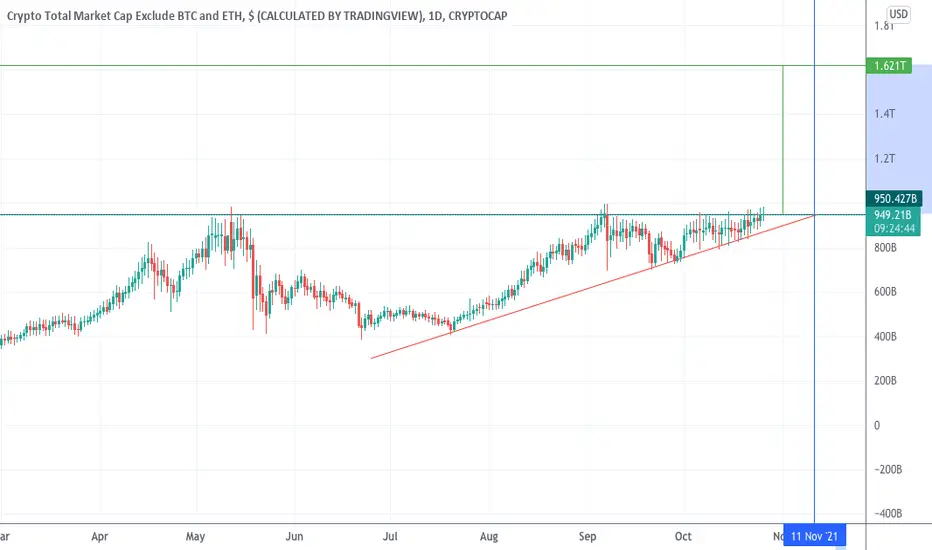
I have been following this massive ascending triangle that has been forming on the TOTAL3 chart since the May correction. Notice how price has been unable to close any daily candles above the flat upper resistance bound. In the past few weeks this chart has consistently printed "doji's" as the consolidation inches closer to the upper resistance line. There is a clear ascending lower resistance bound that has formed as well.
The breakout target for this pattern would indicate a 70% move to the upside for this TOTAL3 index which would send many altcoins parabolic. It appears that price may continue to consolidate inside this pattern formation for up to 2 more weeks (~Nov.12).
My trading plan is to wait for a daily close above the resistance line and then open long positions in a few different altcoins that I feel have been suppressed. Best of luck to all during this coming altseason.

免責聲明
這些資訊和出版物並非旨在提供,也不構成TradingView提供或認可的任何形式的財務、投資、交易或其他類型的建議或推薦。請閱讀使用條款以了解更多資訊。