
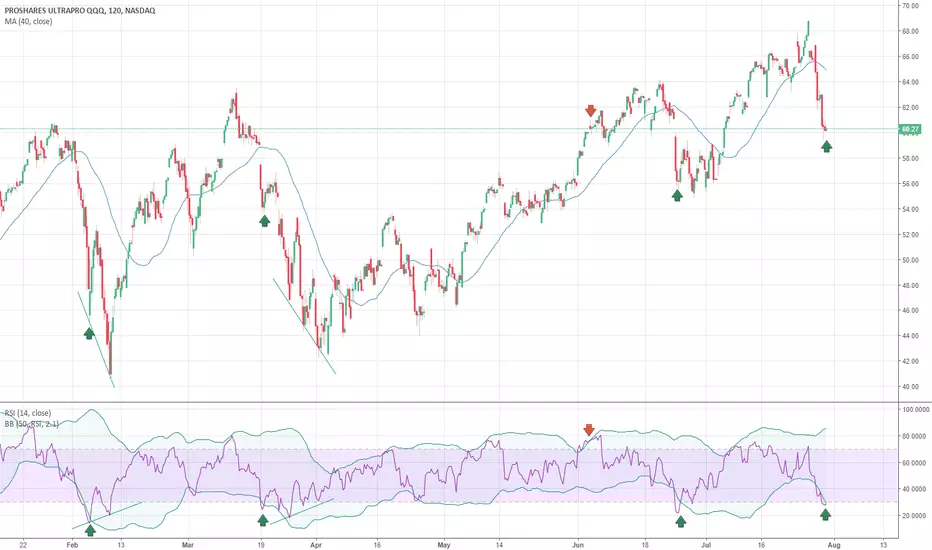
Nasdaq 100 is looking oversold after a bad week for tech. However, after a big selloff the RSI over multiple time frames shows oversold levels. On top of being below the standard 30 level, the RSI dips below the lower adjusted (50 period, 2.1 standard deviations) bollinger band for a more accurate reading of oversold. Over the past 6-months, the combination of the RSI dip below 30 and a dip below the lower band has been an excellent buy signal. Tech isn't going away anytime soon...

免責聲明
這些資訊和出版物並非旨在提供,也不構成TradingView提供或認可的任何形式的財務、投資、交易或其他類型的建議或推薦。請閱讀使用條款以了解更多資訊。