已更新
Terrascend Corp. - $TRSSF Chart Analysis (Continued)
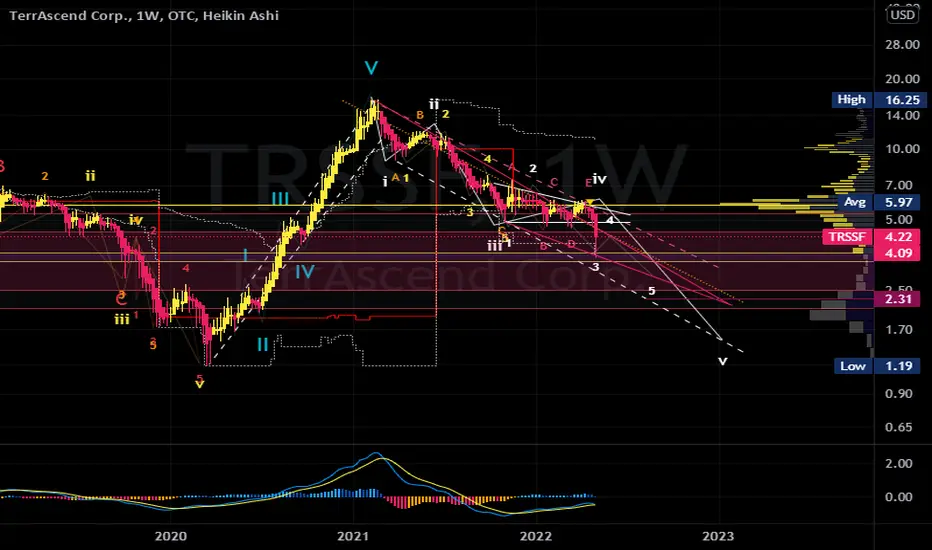
TAKE A HIT OR LET IT SIT?
While hitting my weekly, and daily targets, like most cannabis tickers, TRSSF oversold on May 4th, 5th and 6th. This overselling now pushes this weight down more than expected. (Last chart analysis <4/18/22> : image below)

Very hard oversold after 3rd - 4th alternative correction. This will force 5th wave lower than last expected.
Expect some small pivots north on a semi-cycle correction during the 2nd half of May, but back to the southside afterwards.
Possible $1.53 / Jan. '23
While hitting my weekly, and daily targets, like most cannabis tickers, TRSSF oversold on May 4th, 5th and 6th. This overselling now pushes this weight down more than expected. (Last chart analysis <4/18/22> : image below)
Very hard oversold after 3rd - 4th alternative correction. This will force 5th wave lower than last expected.
Expect some small pivots north on a semi-cycle correction during the 2nd half of May, but back to the southside afterwards.
Possible $1.53 / Jan. '23
註釋
6 weeks of solid charting on this one... noice!
相關出版品
免責聲明
這些資訊和出版物並非旨在提供,也不構成TradingView提供或認可的任何形式的財務、投資、交易或其他類型的建議或推薦。請閱讀使用條款以了解更多資訊。