
Good Sunday my fellow traders, let's look at TRXBTC today.
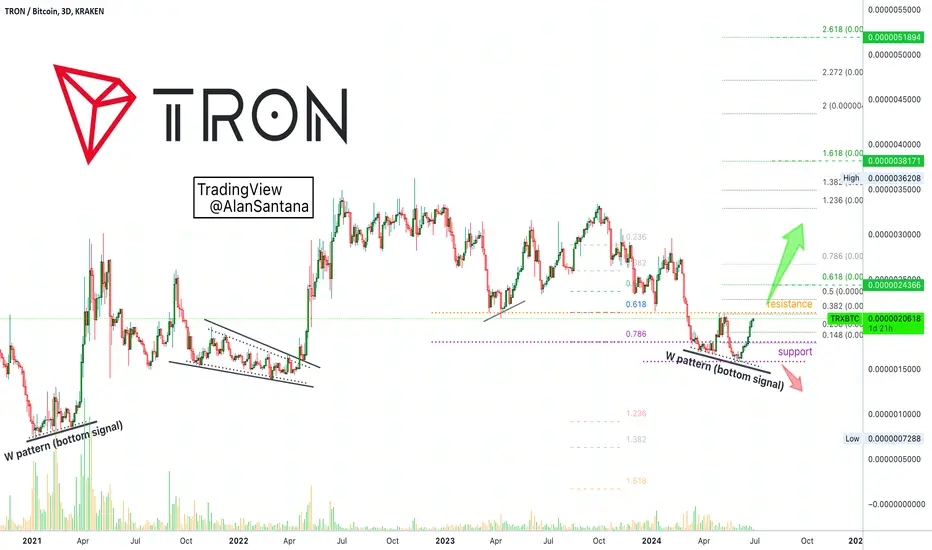
We have a classic "w pattern" on this 3D chart, which is equivalent to a double bottom.
This same pattern worked as a bottom back in early 2021 and something similar can happen here.
Bullish action has been happening for this pair since the start of the month.
Tron can detach from the market.
TRX has its own dimension, it can produce a chart that is completely unrelated to other pairs.
About 85-90% of all trading pairs in the Cryptocurrency market, and the rest of the world, have the exact same chart; this is due to bot trading, algorithms, etc. When a pair/project has a unique chart, this is always a positive sign.
➖ It means this is a real project;
➖ It means that there is real people/entities buying and selling;
➖ It means that something real is happening behind the scenes.
Regardless of the fundamentals, we still focus on technical analysis.
When a trading pair has a unique chart, it can move against the market; It can move first or last; everything is possible and this is good. It is good because there are always opportunities available if we know where to look.
We have good bullish action in the past 24 days but this doesn't mean that the pair will continue growing; no volume at this point is a tricky/mixed signal.
👉 Above "support" bullish.
👉 Below "support" bearish.
See the chart for more details.
Thank you for reading.
Namaste.
We have a classic "w pattern" on this 3D chart, which is equivalent to a double bottom.
This same pattern worked as a bottom back in early 2021 and something similar can happen here.
Bullish action has been happening for this pair since the start of the month.
Tron can detach from the market.
TRX has its own dimension, it can produce a chart that is completely unrelated to other pairs.
About 85-90% of all trading pairs in the Cryptocurrency market, and the rest of the world, have the exact same chart; this is due to bot trading, algorithms, etc. When a pair/project has a unique chart, this is always a positive sign.
➖ It means this is a real project;
➖ It means that there is real people/entities buying and selling;
➖ It means that something real is happening behind the scenes.
Regardless of the fundamentals, we still focus on technical analysis.
When a trading pair has a unique chart, it can move against the market; It can move first or last; everything is possible and this is good. It is good because there are always opportunities available if we know where to look.
We have good bullish action in the past 24 days but this doesn't mean that the pair will continue growing; no volume at this point is a tricky/mixed signal.
👉 Above "support" bullish.
👉 Below "support" bearish.
See the chart for more details.
Thank you for reading.
Namaste.
交易進行
Above resistance = double-bullish.手動結束交易
Market conditions will change.We will revisit after the end of the correction.

💯 TOP Results (Sept 2026) 👇
t.me/masteranandatrades/9279
🔥 10-25X Leverage, Results & Profits
t.me/masteranandatrades/9271
✅ 4 PREMIUM Telegram channels special offer
—One-Time Payment! (🔝 since 2017)
t.me/lamatrades/4
t.me/masteranandatrades/9279
🔥 10-25X Leverage, Results & Profits
t.me/masteranandatrades/9271
✅ 4 PREMIUM Telegram channels special offer
—One-Time Payment! (🔝 since 2017)
t.me/lamatrades/4
相關出版品
免責聲明
這些資訊和出版物並非旨在提供,也不構成TradingView提供或認可的任何形式的財務、投資、交易或其他類型的建議或推薦。請閱讀使用條款以了解更多資訊。
💯 TOP Results (Sept 2026) 👇
t.me/masteranandatrades/9279
🔥 10-25X Leverage, Results & Profits
t.me/masteranandatrades/9271
✅ 4 PREMIUM Telegram channels special offer
—One-Time Payment! (🔝 since 2017)
t.me/lamatrades/4
t.me/masteranandatrades/9279
🔥 10-25X Leverage, Results & Profits
t.me/masteranandatrades/9271
✅ 4 PREMIUM Telegram channels special offer
—One-Time Payment! (🔝 since 2017)
t.me/lamatrades/4
相關出版品
免責聲明
這些資訊和出版物並非旨在提供,也不構成TradingView提供或認可的任何形式的財務、投資、交易或其他類型的建議或推薦。請閱讀使用條款以了解更多資訊。