
Analysis on the Hourly:
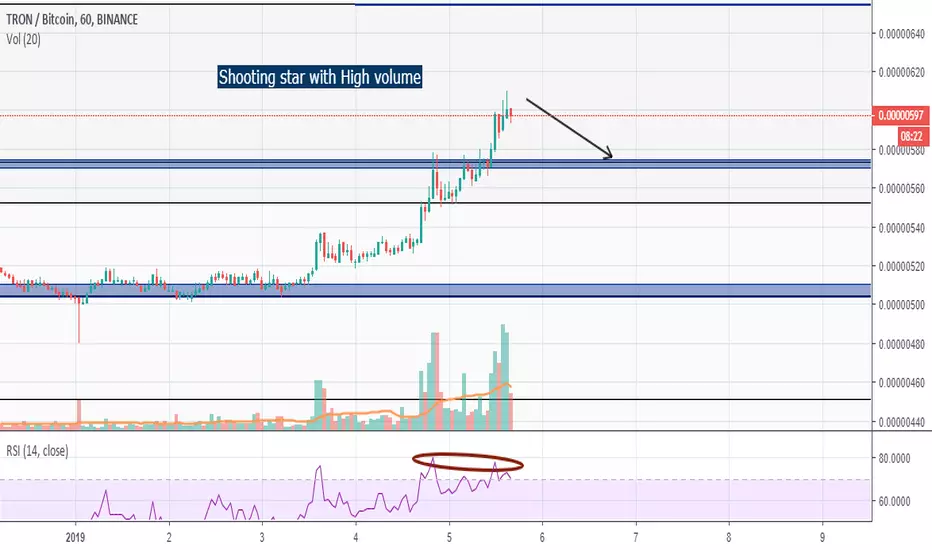
Here we can see a shooting star formed with high volume, this indicates that a lot of selling was done at this point.
If we watch the rsi closely, it formed a double top, which indicates going down.
Now there's two possibilities:
1) Either it keeps going up and touches 652-655 (Fibonacci cluster) ,
2) Or we have a short-term correction to the 570-575.
If 2) occurs, we need to watch that level closely, and find a bullish candle with good volume in order to enter a possible trade to 652-655.
Also, keep in mind that in the 4 hour timeframe, if it forms a hanging man, most likely 2) will occur.
I will keep updating!
If you want to share your ideas , comment down below and like if you enjoyed this analysis.
Here we can see a shooting star formed with high volume, this indicates that a lot of selling was done at this point.
If we watch the rsi closely, it formed a double top, which indicates going down.
Now there's two possibilities:
1) Either it keeps going up and touches 652-655 (Fibonacci cluster) ,
2) Or we have a short-term correction to the 570-575.
If 2) occurs, we need to watch that level closely, and find a bullish candle with good volume in order to enter a possible trade to 652-655.
Also, keep in mind that in the 4 hour timeframe, if it forms a hanging man, most likely 2) will occur.
I will keep updating!
If you want to share your ideas , comment down below and like if you enjoyed this analysis.
註釋
It did the second possibility and rebounded in the fibonacci cluster as predicted交易結束:目標達成
As told in the analysis, it touched our take profit of 652-655.I will post a new chart if anymore trading opportunities occur.

免責聲明
這些資訊和出版物並非旨在提供,也不構成TradingView提供或認可的任何形式的財務、投資、交易或其他類型的建議或推薦。請閱讀使用條款以了解更多資訊。