
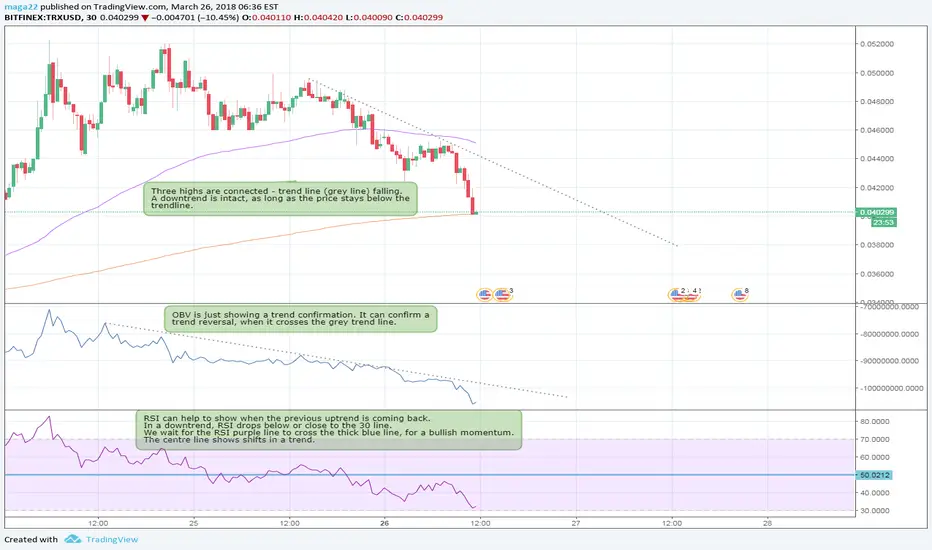
Everything confirms and shows a downtrend, but looking at the trendlines and centre line for the RSI indicator. It seems that we can perhaps hope for a reversal soon
IF
1.Candle stick crosses the grey dotted line and we see higher highs.
2.OBV line crosses grey dotted line and we see an increase
3.RSI crosses centre line (50) for a bullish momentum.
Do you agree with me? If not, please let me know how you would analyse it.
Thanks!
IF
1.Candle stick crosses the grey dotted line and we see higher highs.
2.OBV line crosses grey dotted line and we see an increase
3.RSI crosses centre line (50) for a bullish momentum.
Do you agree with me? If not, please let me know how you would analyse it.
Thanks!

免責聲明
這些資訊和出版物並非旨在提供,也不構成TradingView提供或認可的任何形式的財務、投資、交易或其他類型的建議或推薦。請閱讀使用條款以了解更多資訊。