
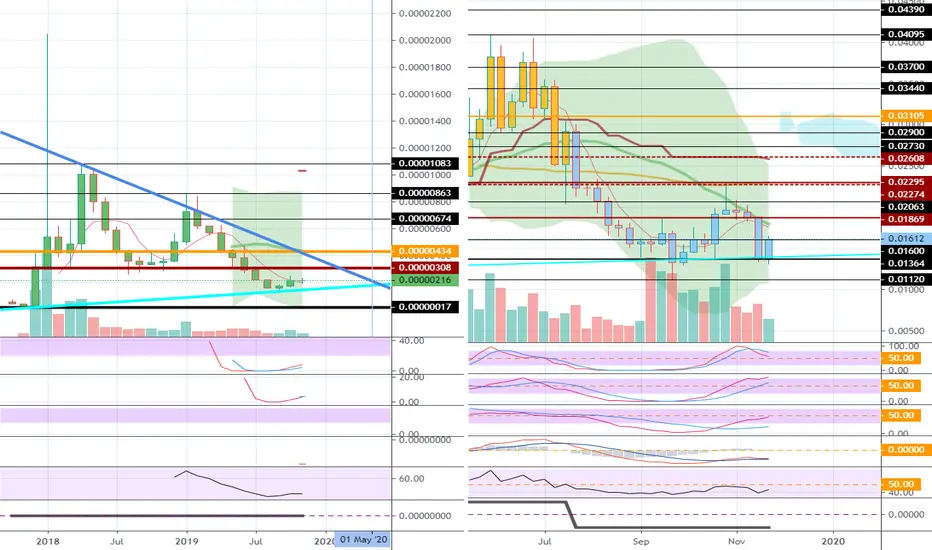
Let's look at the chart in the mid to long term.
A chart of TRXBTC was added.
[TRXBTC]
It is supported by an upward trend line.
The day when the downtrend line meets the uptrend line is around May 2020.
However, the day when the downtrend line meets the 0.00000308 point is around February 2020, so we expect to break out of the downtrend line before May 2020.
The current price position is located in the mid to long term investment area.
We should check if we can break the 0.00000434 point and continue the upward trend.
The target price will be 0.00000434.
[TRXUSDT]
It is supported by the 0.01364 point and the uptrend line.
If you climb above 0.01869 and receive support, you may challenge the 0.02274 point.
The above 0.02274 point is considered as a point to continue the short-term uptrend.
Below 0.01364 is a long-term investment area.
A chart of TRXBTC was added.
[TRXBTC]
It is supported by an upward trend line.
The day when the downtrend line meets the uptrend line is around May 2020.
However, the day when the downtrend line meets the 0.00000308 point is around February 2020, so we expect to break out of the downtrend line before May 2020.
The current price position is located in the mid to long term investment area.
We should check if we can break the 0.00000434 point and continue the upward trend.
The target price will be 0.00000434.
[TRXUSDT]
It is supported by the 0.01364 point and the uptrend line.
If you climb above 0.01869 and receive support, you may challenge the 0.02274 point.
The above 0.02274 point is considered as a point to continue the short-term uptrend.
Below 0.01364 is a long-term investment area.

[Practical trading strategy using HA-MS and SBOD]
youtu.be/aceN1AttX1Y
[Renko Bot]
readcrypto.kr/live
youtu.be/aceN1AttX1Y
[Renko Bot]
readcrypto.kr/live
相關出版品
免責聲明
這些資訊和出版物並非旨在提供,也不構成TradingView提供或認可的任何形式的財務、投資、交易或其他類型的建議或推薦。請閱讀使用條款以了解更多資訊。
[Practical trading strategy using HA-MS and SBOD]
youtu.be/aceN1AttX1Y
[Renko Bot]
readcrypto.kr/live
youtu.be/aceN1AttX1Y
[Renko Bot]
readcrypto.kr/live
相關出版品
免責聲明
這些資訊和出版物並非旨在提供,也不構成TradingView提供或認可的任何形式的財務、投資、交易或其他類型的建議或推薦。請閱讀使用條款以了解更多資訊。