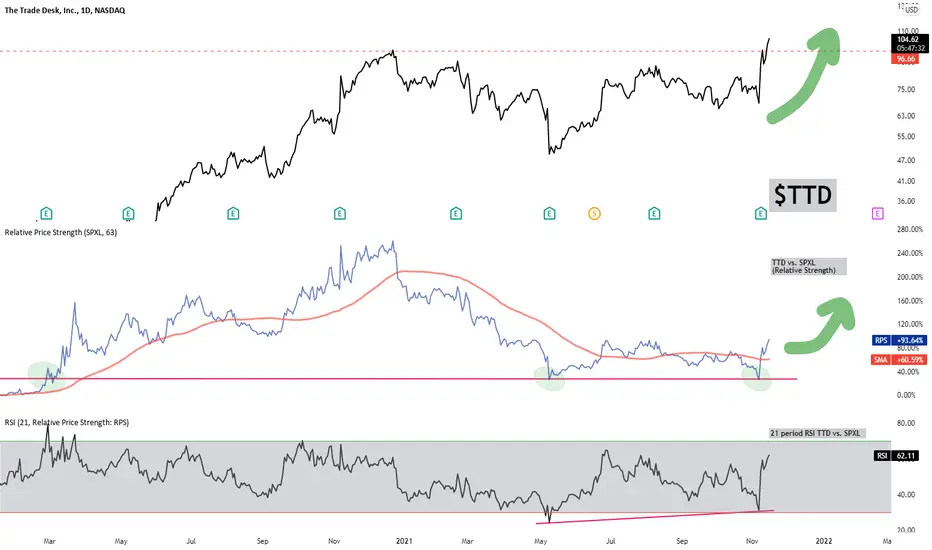
This is a great example of a favorite chart construct of mine. Regardless of the ticker (although I do favor  TTD) I find this chart construction to be very beneficial to keeping things simple, effective and efficient. The following are key takeaways...
dgorghuber (TV)
@Futures_Runner (Twitter)
TTD) I find this chart construction to be very beneficial to keeping things simple, effective and efficient. The following are key takeaways...- Top third - Current price, line chart - looking for absolute support/resistance, uptrending/downtrending specifics. --->>> K.I.S.S. mentality here.
- Middle third - Price of underlying vs.
 SPXL (in this case) - Relative strength of the underlying security vs. SPXL gives a great shot of whether or not I even need to be considering a specific holding over $SPXL. I also show the 63 day SMA on this ratio chart.
- Bottom third - RSI of the RS chart (middle third) - the goal here is to look for trending momentum either up or down as well as spotting critical divergences. I find divergences of this magnitude to be more reliable (tradeable) than your average price of underlying divergence. Shown is an example with $TTD..
dgorghuber (TV)
@Futures_Runner (Twitter)

Dan J. Gorghuber, CMT
免責聲明
這些資訊和出版物並非旨在提供,也不構成TradingView提供或認可的任何形式的財務、投資、交易或其他類型的建議或推薦。請閱讀使用條款以了解更多資訊。
Dan J. Gorghuber, CMT
免責聲明
這些資訊和出版物並非旨在提供,也不構成TradingView提供或認可的任何形式的財務、投資、交易或其他類型的建議或推薦。請閱讀使用條款以了解更多資訊。