
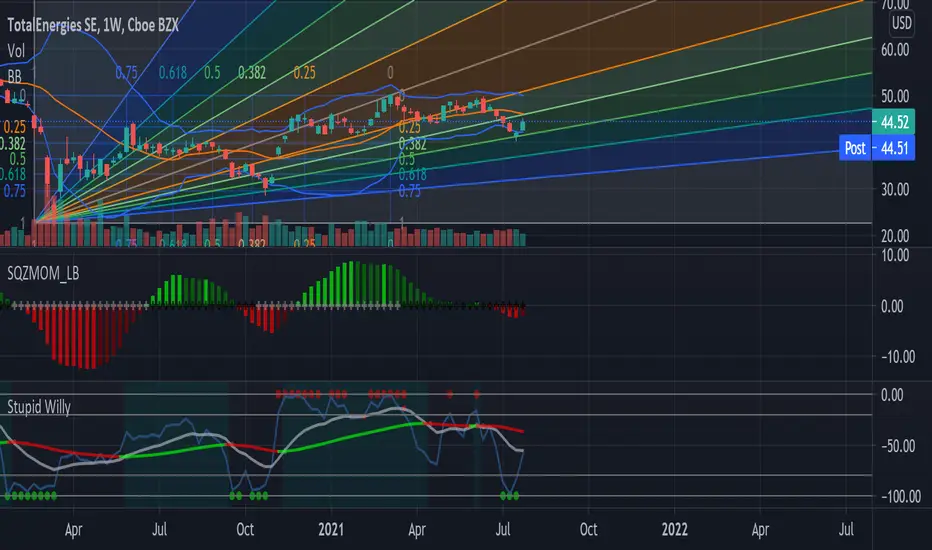
TTE has retraced to one of its Fibonacci supports and have bounced off of it pretty significantly. Not only is it holding support, but there is greater indication of a greater bullish move. The %R indicates that a oversold condition was not too long ago with the addition of selling momentum reducing greatly, given by the Squeeze indicator. My price targets are 47, 50 then 57 if it gains a substantial amount of bullish momentum. For a significant sell signal, let the squeeze play out until there is a reduction in momentum.
Bullish Signals
-%R oscillator
-Squeeze indicator
-Fibonacci Support
Price Targets
-1st 47
-2nd 50
-3rd 57
Bullish Signals
-%R oscillator
-Squeeze indicator
-Fibonacci Support
Price Targets
-1st 47
-2nd 50
-3rd 57

免責聲明
這些資訊和出版物並非旨在提供,也不構成TradingView提供或認可的任何形式的財務、投資、交易或其他類型的建議或推薦。請閱讀使用條款以了解更多資訊。