
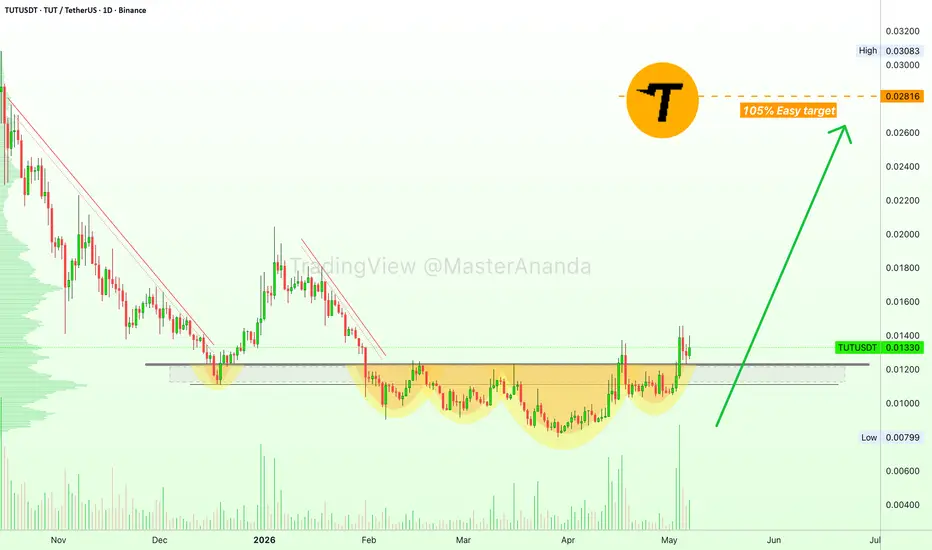
Here we have a dividing line between bears and bulls, the bearish and bullish zone, right around 0.1200. Below this line TUTUSDT wasn't really trending but more like consolidating. Above this line, a change of trend can develop. Notice how trading volume has been rising steadily for the past five months. Notice the size of the green bars vs the red ones. Accumulation has been taking place. Now that the action has recovered above the long-term bottom, we can expect a nice jump. This is a short-term trade setup and we are aiming for a nice and easy 100%. The target can be seen on the chart. This level can hit within several weeks just as it can take only a few days. It depends on when the market force reaches this project. The bulls have the upper-hand.
Namaste.
Namaste.

✅ Cryptocurrencies technical analysis & results
t.me/masteranandatrades/9279
✅ Stocks technical analysis
t.me/anandastocks
✅ Enjoyed the content? Join my PREMIUM channels for more... t.me/lamatrades/4 (since 2017)
t.me/masteranandatrades/9279
✅ Stocks technical analysis
t.me/anandastocks
✅ Enjoyed the content? Join my PREMIUM channels for more... t.me/lamatrades/4 (since 2017)
相關出版品
免責聲明
這些資訊和出版物並非旨在提供,也不構成TradingView提供或認可的任何形式的財務、投資、交易或其他類型的建議或推薦。請閱讀使用條款以了解更多資訊。
✅ Cryptocurrencies technical analysis & results
t.me/masteranandatrades/9279
✅ Stocks technical analysis
t.me/anandastocks
✅ Enjoyed the content? Join my PREMIUM channels for more... t.me/lamatrades/4 (since 2017)
t.me/masteranandatrades/9279
✅ Stocks technical analysis
t.me/anandastocks
✅ Enjoyed the content? Join my PREMIUM channels for more... t.me/lamatrades/4 (since 2017)
相關出版品
免責聲明
這些資訊和出版物並非旨在提供,也不構成TradingView提供或認可的任何形式的財務、投資、交易或其他類型的建議或推薦。請閱讀使用條款以了解更多資訊。