
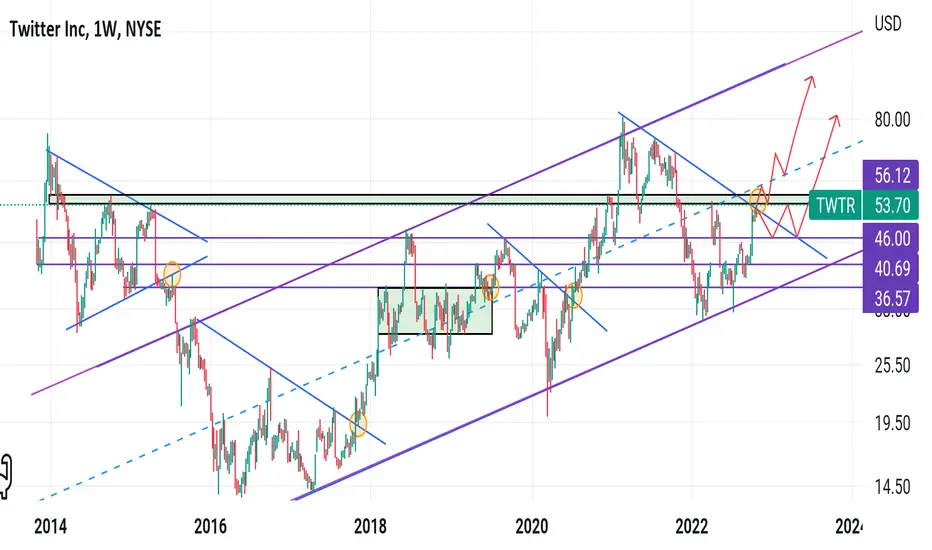
This is the all time weekly chart of twitter usd. The concept is simple and clear for you all in the chart. I mean whether the yellow circle dots mean, the confirmation of the breakout for long and short.
Now the current scenario is, if we close above the 56 level on weekly timeframe. Then the possibility is, that there will be a new all time high coming for the twiterusd token.
And secondly if the the breakout fail, then we can buy at 46 level and open for long term holding target for twitter usd token.
Manage your own risk accordingly with that
Now the current scenario is, if we close above the 56 level on weekly timeframe. Then the possibility is, that there will be a new all time high coming for the twiterusd token.
And secondly if the the breakout fail, then we can buy at 46 level and open for long term holding target for twitter usd token.
Manage your own risk accordingly with that

免責聲明
這些資訊和出版物並非旨在提供,也不構成TradingView提供或認可的任何形式的財務、投資、交易或其他類型的建議或推薦。請閱讀使用條款以了解更多資訊。
免責聲明
這些資訊和出版物並非旨在提供,也不構成TradingView提供或認可的任何形式的財務、投資、交易或其他類型的建議或推薦。請閱讀使用條款以了解更多資訊。