
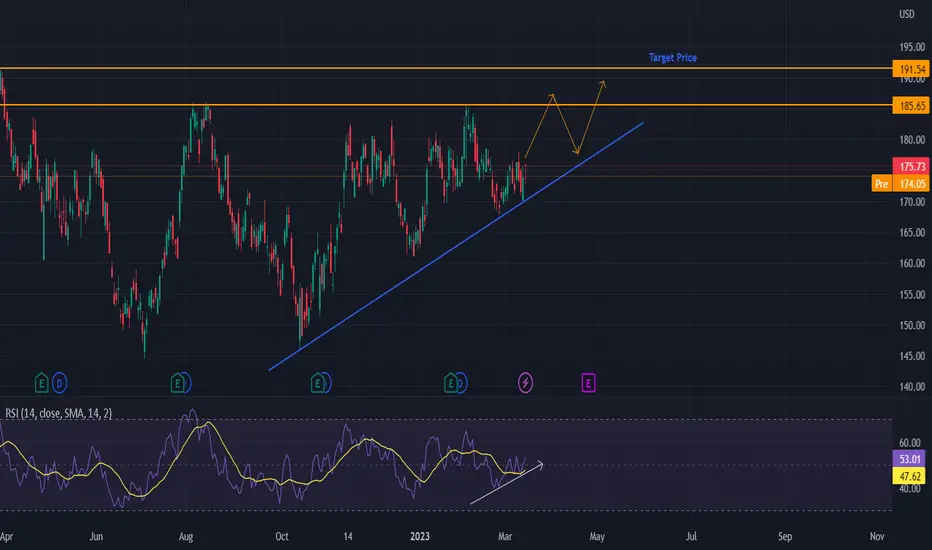
On the chart we can see that there are higher highs and higher lows. The RSI indicator crossing above the 50 mark and heading upward, indicates a bullish momentum. We expect that the price will reach the resistance. As it is a strong resistance, we anticipate the price to get rejected. Next, we expect another upsloping attempt towards the resistance level. Invalidation of this theses would be if the price closes below the upsloping trendline.
註釋
The price got rejected from the resistance and found support on the upsloping rendline again. So far so good. The target price remains unchanged.
💥 Free signals and ideas ➡ t.me/vfinvestment
相關出版品
免責聲明
這些資訊和出版物並非旨在提供,也不構成TradingView提供或認可的任何形式的財務、投資、交易或其他類型的建議或推薦。請閱讀使用條款以了解更多資訊。
💥 Free signals and ideas ➡ t.me/vfinvestment
相關出版品
免責聲明
這些資訊和出版物並非旨在提供,也不構成TradingView提供或認可的任何形式的財務、投資、交易或其他類型的建議或推薦。請閱讀使用條款以了解更多資訊。