
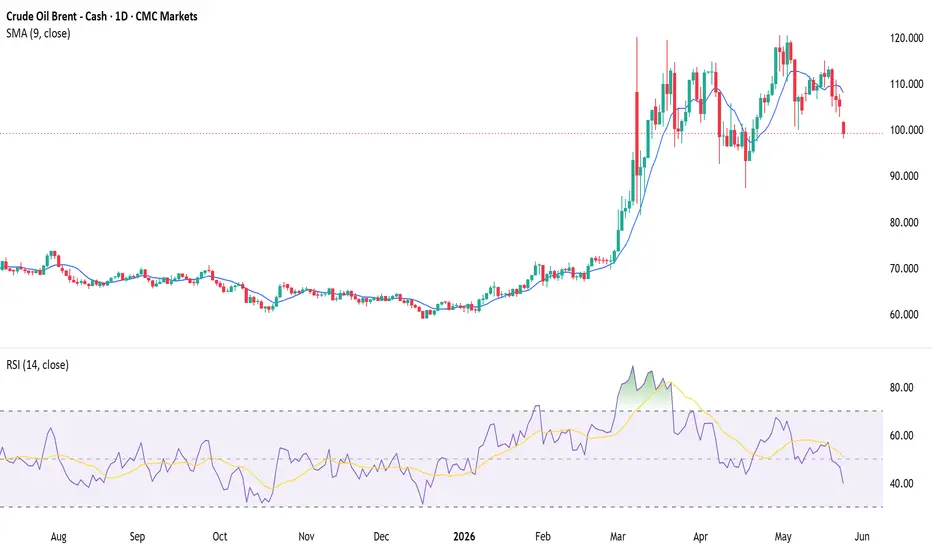
Oil prices are falling sharply as talks of peace between the US and Iran give traders hope that the Strait of Hormuz will remain open and that oil will begin to flow out of the region. This has brought Brent crude below $100 and is now approaching a key support range between $93 and $96.
The last time Brent reached that area of support was in early April, and it proved to be an important level that not only held but also allowed oil to rebound and push to new highs around $119. Now, that area takes on an even greater role because a break of support this time could confirm a double-top pattern that has formed in oil.
The region between $93 and $96 may now serve as the neckline of the double-top pattern, and a break below that neckline could send Brent prices back to where they traded before the war began in late February, around $72.
However, if the neckline and support area hold, it could indicate that oil prices are heading back towards the previous highs near $119 and, more importantly, could eventually move even higher.
For now, the relative strength index has turned lower, suggesting that bearish momentum in oil has taken over and increasing the odds of a test of support.
This has quickly become a very big test for oil that may determine the next big swing in prices.

Written by Michael J. Kramer, founder of Mott Capital Management.
Disclaimer: CMC Markets is an execution-only service provider. The material (whether or not it states any opinions) is for general information purposes only and does not take into account your personal circumstances or objectives. Nothing in this material is (or should be considered to be) financial, investment or other advice on which reliance should be placed.
No opinion given in the material constitutes a recommendation by CMC Markets or the author that any particular investment, security, transaction, or investment strategy is suitable for any specific person. The material has not been prepared in accordance with legal requirements designed to promote the independence of investment research. Although we are not specifically prevented from dealing before providing this material, we do not seek to take advantage of the material prior to its dissemination.
The last time Brent reached that area of support was in early April, and it proved to be an important level that not only held but also allowed oil to rebound and push to new highs around $119. Now, that area takes on an even greater role because a break of support this time could confirm a double-top pattern that has formed in oil.
The region between $93 and $96 may now serve as the neckline of the double-top pattern, and a break below that neckline could send Brent prices back to where they traded before the war began in late February, around $72.
However, if the neckline and support area hold, it could indicate that oil prices are heading back towards the previous highs near $119 and, more importantly, could eventually move even higher.
For now, the relative strength index has turned lower, suggesting that bearish momentum in oil has taken over and increasing the odds of a test of support.
This has quickly become a very big test for oil that may determine the next big swing in prices.
Written by Michael J. Kramer, founder of Mott Capital Management.
Disclaimer: CMC Markets is an execution-only service provider. The material (whether or not it states any opinions) is for general information purposes only and does not take into account your personal circumstances or objectives. Nothing in this material is (or should be considered to be) financial, investment or other advice on which reliance should be placed.
No opinion given in the material constitutes a recommendation by CMC Markets or the author that any particular investment, security, transaction, or investment strategy is suitable for any specific person. The material has not been prepared in accordance with legal requirements designed to promote the independence of investment research. Although we are not specifically prevented from dealing before providing this material, we do not seek to take advantage of the material prior to its dissemination.

免責聲明
這些資訊和出版物並非旨在提供,也不構成TradingView提供或認可的任何形式的財務、投資、交易或其他類型的建議或推薦。請閱讀使用條款以了解更多資訊。
免責聲明
這些資訊和出版物並非旨在提供,也不構成TradingView提供或認可的任何形式的財務、投資、交易或其他類型的建議或推薦。請閱讀使用條款以了解更多資訊。