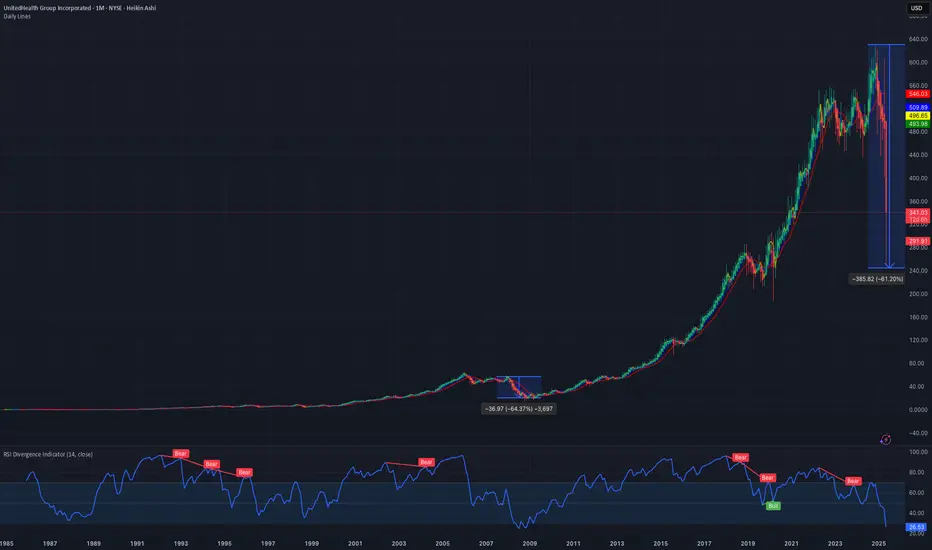
 UNH with one after bad news lost 60% of its market cap from its ATH of 600$. UNH the largest insurer in US has been in news for all the wrong reasons. The stock after losing 60% of the value has a dividend yield of 3.1% which is 2.5 times of the S&P Yield. The historical dividend growth of UNH has been more than 8%. This makes UNH a compelling story stock during the recent downturn. With recent insider buys of the UNH stock most of the fundamental indicators indicate a positive outlook.
 But what are the technical indicators telling us? Today we are looking at the historical chart of the stock. The last time the stock was down more than 60% was during the 2007-2008 Financial recession. In 2008 it did lose more than 64%. If we investigate the long term RSI then we see it below 25 which we also saw last during the Financial recession.
Verdict : Buy 1/3 @ 250, Buy 1/3 @ 275, Buy 1/3 now.

免責聲明
這些資訊和出版物並非旨在提供,也不構成TradingView提供或認可的任何形式的財務、投資、交易或其他類型的建議或推薦。請閱讀使用條款以了解更多資訊。
免責聲明
這些資訊和出版物並非旨在提供,也不構成TradingView提供或認可的任何形式的財務、投資、交易或其他類型的建議或推薦。請閱讀使用條款以了解更多資訊。