
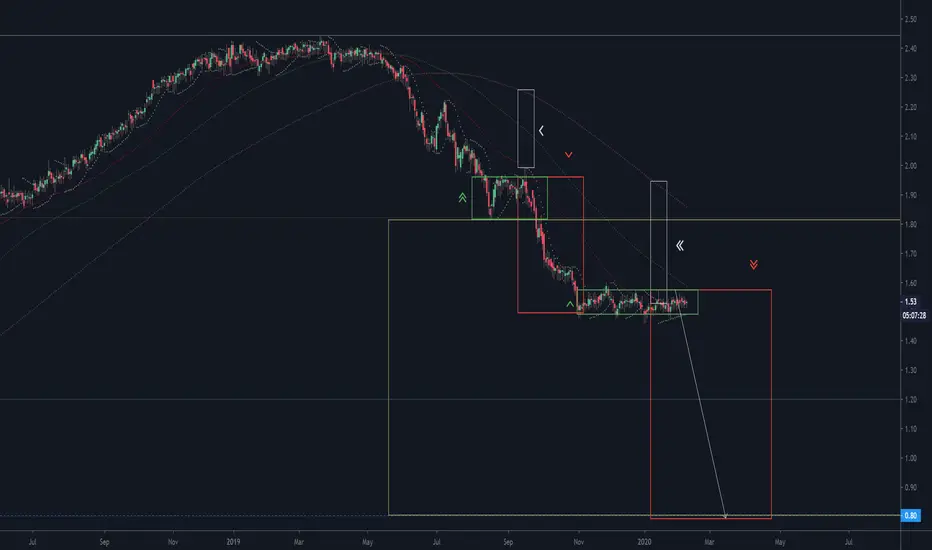
US03M chart before another plunge. The chart shows the forward rate curve for US 3-month government bonds. I've analyzed this curve many times. It can be seen that the chart makes small movements. Furthermore, it can be seen that the anti-movement ATRs (white rectangle) have a strong pressure on the exchange rate. In the event that the exchange rate falls out of this narrow-band siding, another sharp drop would occur. What it means. That the three-month forward dollar rates are coming under pressure again. The market expects another interest rate cut. This could lead to a weakening of the dollar. I note that forward rates on 2-year and 10-year government bonds are already falling. They are around 1.3%. Which tells me that maybe not in the short term, in the next 2-3 years the market can expect another dollar cut in interest rates.

免責聲明
這些資訊和出版物並非旨在提供,也不構成TradingView提供或認可的任何形式的財務、投資、交易或其他類型的建議或推薦。請閱讀使用條款以了解更多資訊。