做多
February 2 NASDAQ US100 Chart Analysis
Hello,
“Make it simple, make profit”
It’s BitcoinGuide.
Don’t forget to
“Follow” me and press “Likes”.
If you "follow" press,
In real time, you can check major sections and move,
Real-time "update I dea" can be checked.
I will begin NASDAQ ZeroMarket US100 Chart Analysis for February 2.
This is a 30 minute chart created last Friday.
According to the black finger movement,
Long -> Short -> Long
It was a switching strategy.
The target is slightly off,
But , Achieved a lot of profit.
Congratulations to all the profitable people.
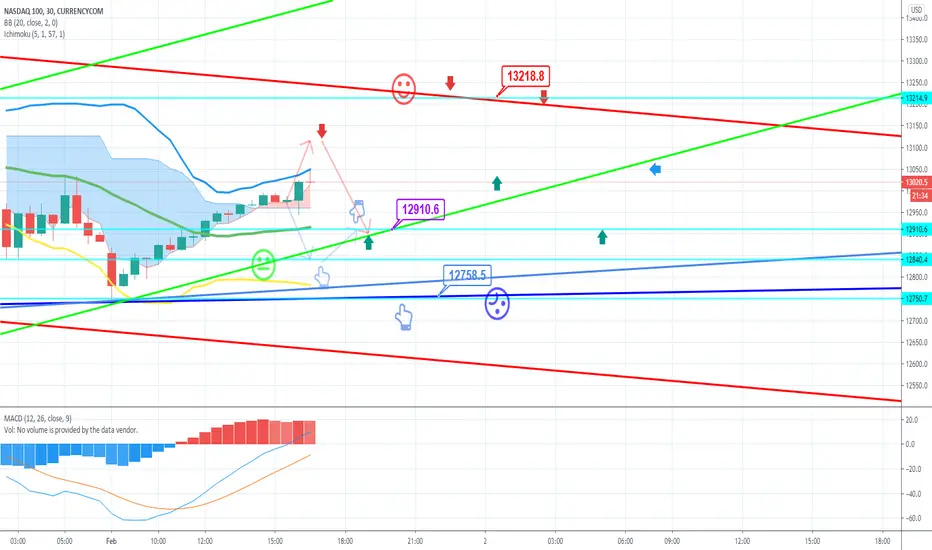
This is a 30-minute chart long position strategy.
Last week, a danger signal passed.
Also, the rising pattern is alive now.
Based on the green support line,
*Red arrow movement path long -> short switching strategy.
Because breaking through the Higtest section seems difficult,
After proper liquidation, short position operation.
After entering the long, the stop loss is a departure from the green support line.
*Sky blue finger movement path,
Short -> Long switching strategy.
The support line is still solid.
Instead, when the sky blue finger moves,
If there is no strong rebound,
There may be further decline tomorrow.
Stop loss is required, please operate safely in each position.
Thank you.
交易結束:目標達成
255.3 profit.

[Bitcoin Guide Affiliate]
*Bybit 20%DC Lifetime + $30,100
partner.bybit.com/b/Bitcoin_Guide
*BingX 50%DC + $14,100
bit.ly/3E8ZkAW
*ZeroMarket ECN 40%DC
bit.ly/3pY0dUv
*Telegram
t.me/bitcoinguide_TM
*Bybit 20%DC Lifetime + $30,100
partner.bybit.com/b/Bitcoin_Guide
*BingX 50%DC + $14,100
bit.ly/3E8ZkAW
*ZeroMarket ECN 40%DC
bit.ly/3pY0dUv
*Telegram
t.me/bitcoinguide_TM
相關出版品
免責聲明
這些資訊和出版物並非旨在提供,也不構成TradingView提供或認可的任何形式的財務、投資、交易或其他類型的建議或推薦。請閱讀使用條款以了解更多資訊。