
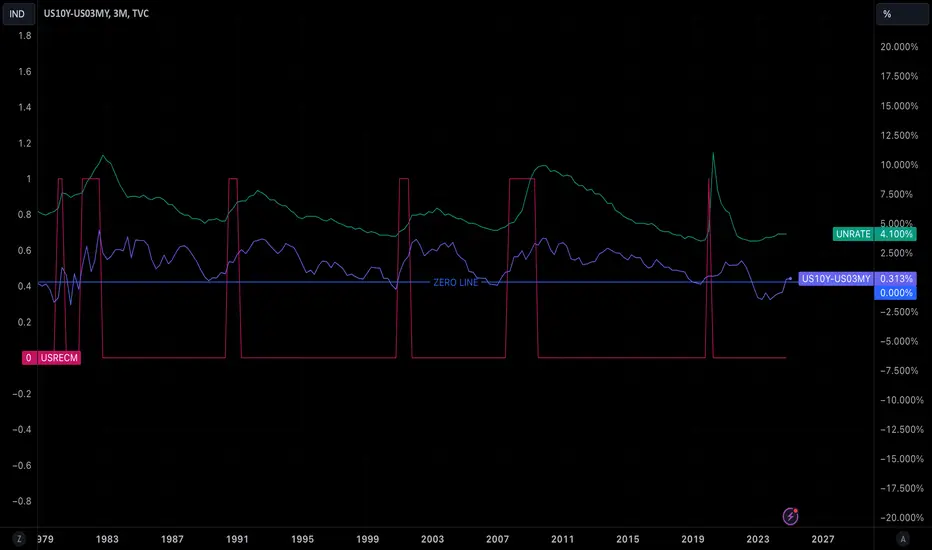
The chart combines the 3. The center blue horizontal line is the 0 line. When the yield curve "un-inverts", as it is happening now, recession follows.
註釋
RED - US RecessionBLUE - Yield inversion.
GREEN - Unemployment Rate

免責聲明
這些資訊和出版物並非旨在提供,也不構成TradingView提供或認可的任何形式的財務、投資、交易或其他類型的建議或推薦。請閱讀使用條款以了解更多資訊。
免責聲明
這些資訊和出版物並非旨在提供,也不構成TradingView提供或認可的任何形式的財務、投資、交易或其他類型的建議或推薦。請閱讀使用條款以了解更多資訊。