
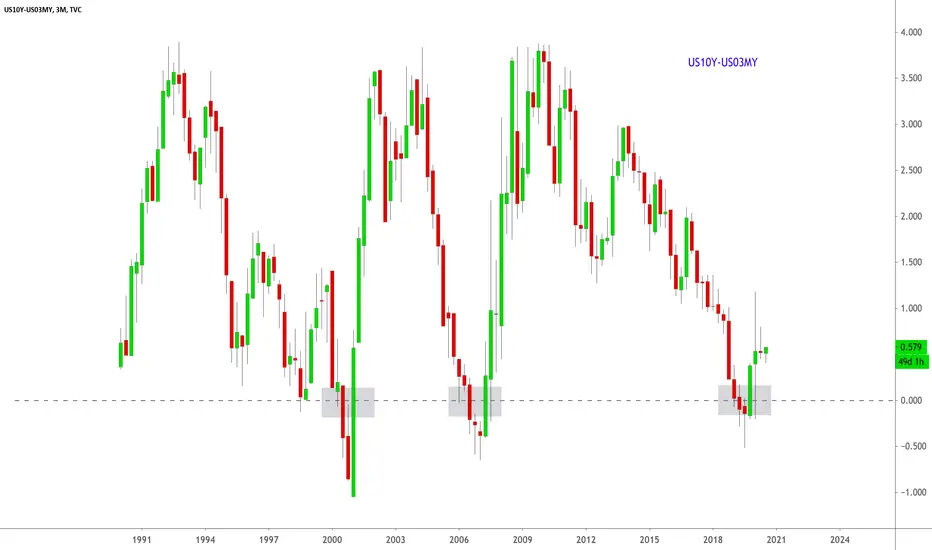
This was the first chart that signaled a recession in April of 2020 when the curve first inverted last year in May. This was pure luck, by simply drawing a fractal of previous yield curve inversions from past recessions from May, which was around 360 days from the TA that suggested the market would recess in April of 2020. Obviously covid is a black-swan--unpredictable and un-speculative--however the bond markets continue to get this all correct, 6-12 months in advance.
Keep your tabs on the curve.
Keep your tabs on the curve.

免責聲明
這些資訊和出版物並非旨在提供,也不構成TradingView提供或認可的任何形式的財務、投資、交易或其他類型的建議或推薦。請閱讀使用條款以了解更多資訊。