
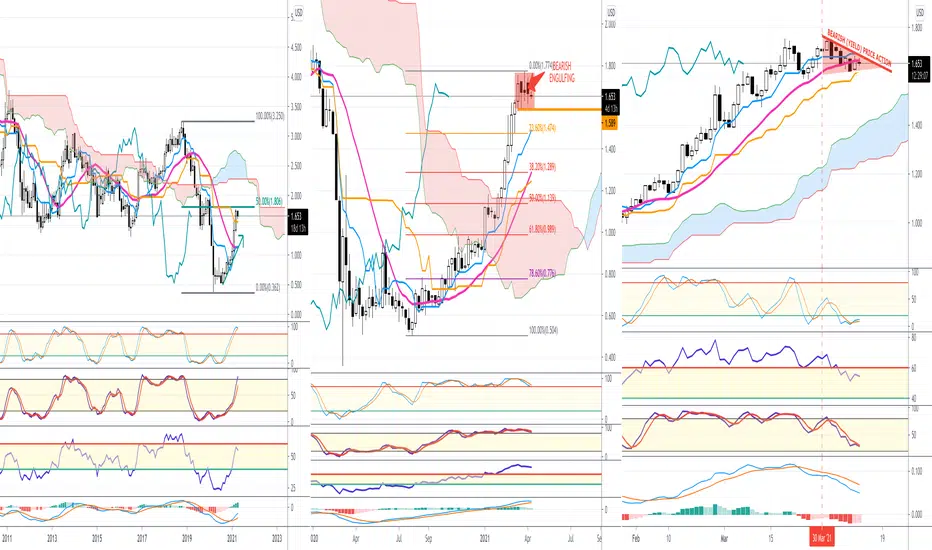
M1 : Long term picture is showing a failure to breakout the 50 % Fibonacci retracement
@ 1.8060 % , high seen being 1.7740 %
Price action seen during February and March is showing, first of all, a breakout of the Mid Bollinger
Band, which was at that time @ 1.1460% in February which has been confirmed by a second breakout of the Kijun-Sen line
which was at that time in March @ 1.5660 (same level now).
Therefore, on a monthly view and on a closing basis a move below 1.5660 would trigger further downside move.
W1 : Price action seen over the last couple of weeks is showing some lack of momentum; indeed after a succession of white
candles we can see a clear break of the upside movement which triggered a sideways price action with a bearish engulfing pattern
which took place last week
Trigger level on this time frame is @ 1.5890 (see D1 comment below)
D1 : Currently in a bearish (yield) mode price action. Mid Bollinger band is under attack with already one closing price below it.
A failure to hold above 1.5890 would confirm a double top pattern in opening the door for a technical target of 1.4040% which is currently
the middle zone of the daily clouds support !
@ 1.8060 % , high seen being 1.7740 %
Price action seen during February and March is showing, first of all, a breakout of the Mid Bollinger
Band, which was at that time @ 1.1460% in February which has been confirmed by a second breakout of the Kijun-Sen line
which was at that time in March @ 1.5660 (same level now).
Therefore, on a monthly view and on a closing basis a move below 1.5660 would trigger further downside move.
W1 : Price action seen over the last couple of weeks is showing some lack of momentum; indeed after a succession of white
candles we can see a clear break of the upside movement which triggered a sideways price action with a bearish engulfing pattern
which took place last week
Trigger level on this time frame is @ 1.5890 (see D1 comment below)
D1 : Currently in a bearish (yield) mode price action. Mid Bollinger band is under attack with already one closing price below it.
A failure to hold above 1.5890 would confirm a double top pattern in opening the door for a technical target of 1.4040% which is currently
the middle zone of the daily clouds support !

免責聲明
這些資訊和出版物並非旨在提供,也不構成TradingView提供或認可的任何形式的財務、投資、交易或其他類型的建議或推薦。請閱讀使用條款以了解更多資訊。