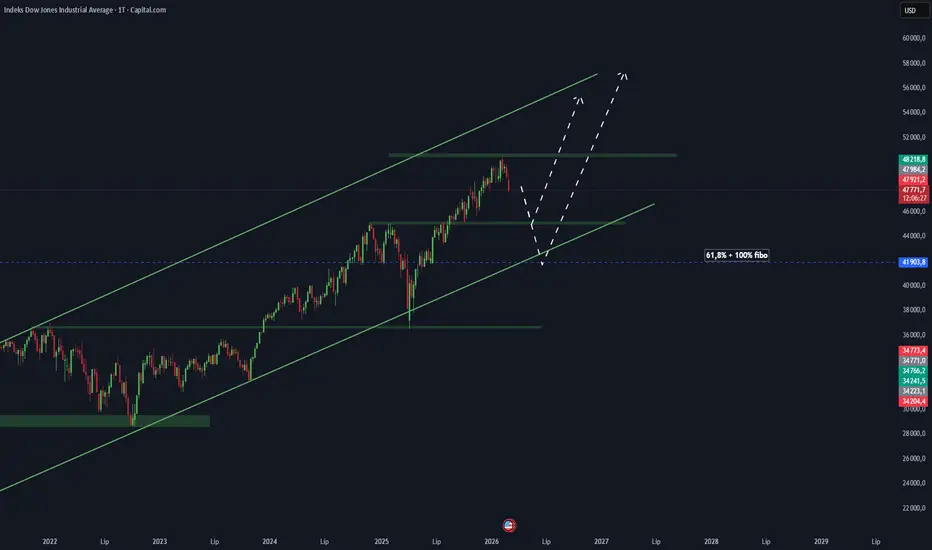
The Dow Jones Industrial Average (DJ30) remains in a long-term uptrend. Since 2023 the index has been moving inside an ascending channel, consistently forming higher highs and higher lows.
At the moment, price has reached a strong resistance zone around 50,000, where sellers have started to react and the market is showing signs of a short-term pullback.
📉 Potential scenario:
• pullback toward the nearest support zone around 45k–46k
• possible deeper correction toward ~41.9k (61.8% Fibonacci), which also aligns with the lower trendline of the ascending channel
📈 If one of these support areas holds, the base scenario remains:
correction → higher low → continuation of the uptrend, US30 with a potential breakout above 50k.
For now, this looks more like a healthy correction within an ongoing uptrend, rather than a trend reversal.
At the moment, price has reached a strong resistance zone around 50,000, where sellers have started to react and the market is showing signs of a short-term pullback.
📉 Potential scenario:
• pullback toward the nearest support zone around 45k–46k
• possible deeper correction toward ~41.9k (61.8% Fibonacci), which also aligns with the lower trendline of the ascending channel
📈 If one of these support areas holds, the base scenario remains:
correction → higher low → continuation of the uptrend,
US30 with a potential breakout above 50k.For now, this looks more like a healthy correction within an ongoing uptrend, rather than a trend reversal.

免責聲明
這些資訊和出版物並非旨在提供,也不構成TradingView提供或認可的任何形式的財務、投資、交易或其他類型的建議或推薦。請閱讀使用條款以了解更多資訊。
免責聲明
這些資訊和出版物並非旨在提供,也不構成TradingView提供或認可的任何形式的財務、投資、交易或其他類型的建議或推薦。請閱讀使用條款以了解更多資訊。