做空
US30: Price Forms a Rising Wedge Pattern
-INTRODUCTION-
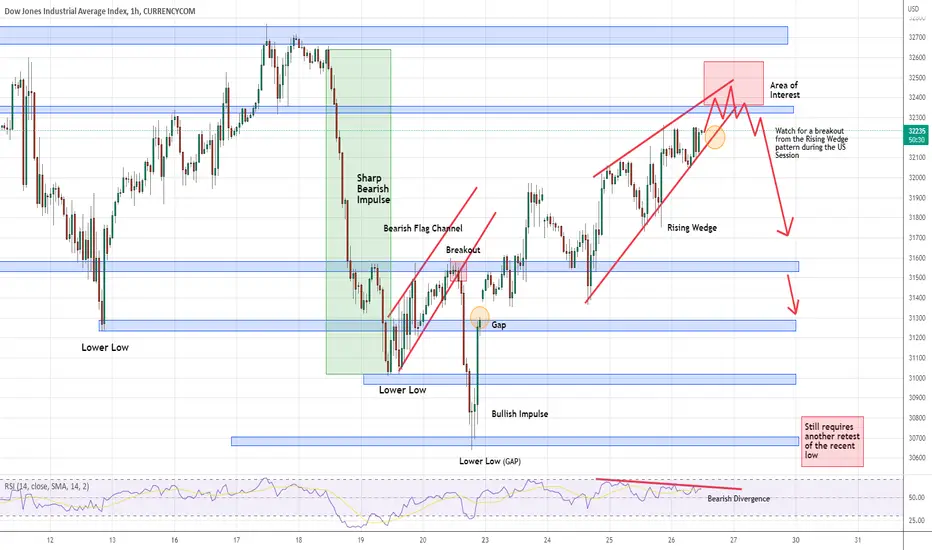
US30 currently has two gaps which are not filled. One is the recent low at the $30650 level while another one is at the $31300 level. In 1-hour chart, we can see that the price has formed a rising wedge pattern, along with a bearish divergence in RSI. Therefore, we expect a sharp bearish breakout sometimes very soon, similar to the last retracement breakout.
-TRADING PLAN-
We will carefully monitor the price movement during the US session today to see whether the price will break the rising wedge pattern.
We love to trade rising/falling wedge patterns. Breaking the pattern often creates a strong price impulse, especially when the pattern is formed as a retracement. Check out our recent retracement trading ideas below :)
US30 currently has two gaps which are not filled. One is the recent low at the $30650 level while another one is at the $31300 level. In 1-hour chart, we can see that the price has formed a rising wedge pattern, along with a bearish divergence in RSI. Therefore, we expect a sharp bearish breakout sometimes very soon, similar to the last retracement breakout.
-TRADING PLAN-
We will carefully monitor the price movement during the US session today to see whether the price will break the rising wedge pattern.
We love to trade rising/falling wedge patterns. Breaking the pattern often creates a strong price impulse, especially when the pattern is formed as a retracement. Check out our recent retracement trading ideas below :)

相關出版品
免責聲明
這些資訊和出版物並非旨在提供,也不構成TradingView提供或認可的任何形式的財務、投資、交易或其他類型的建議或推薦。請閱讀使用條款以了解更多資訊。