
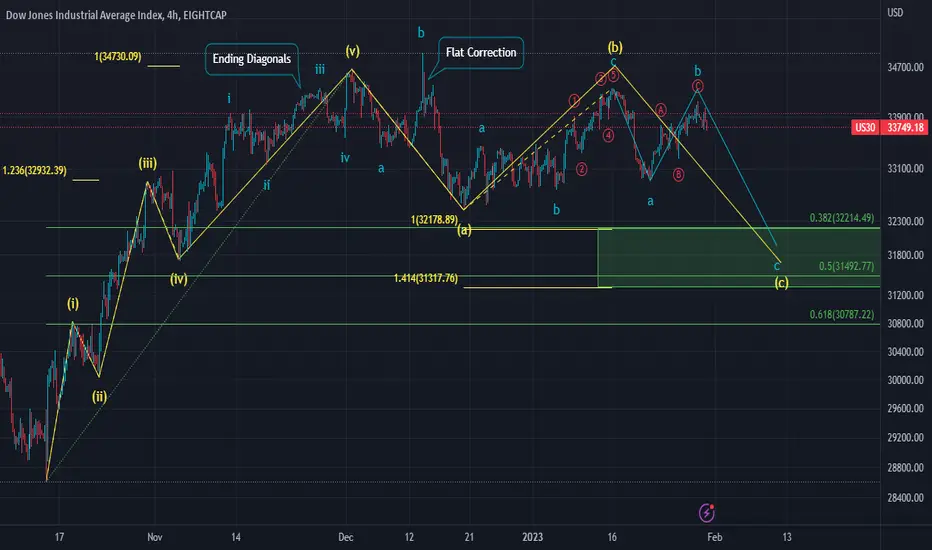
I have broken down the entire wave structure of the upward impulse which started in October 2022 up to today.
The chart is self explanatory and consist of my main wave count of US30 Index. Right now we are starting our Wave C of corrective cycle which is expected to bottom in the given range but the outlook can change depending on the upcoming news.
The chart is self explanatory and consist of my main wave count of US30 Index. Right now we are starting our Wave C of corrective cycle which is expected to bottom in the given range but the outlook can change depending on the upcoming news.
交易進行
Since the News came as expected i.e. 25 points increase, the market reacted bullish changing the sub-wave structure as shown in chart below.Though I am still bearish at this point and expecting market to drop starting tomorrow.

免責聲明
這些資訊和出版物並非旨在提供,也不構成TradingView提供或認可的任何形式的財務、投資、交易或其他類型的建議或推薦。請閱讀使用條款以了解更多資訊。