
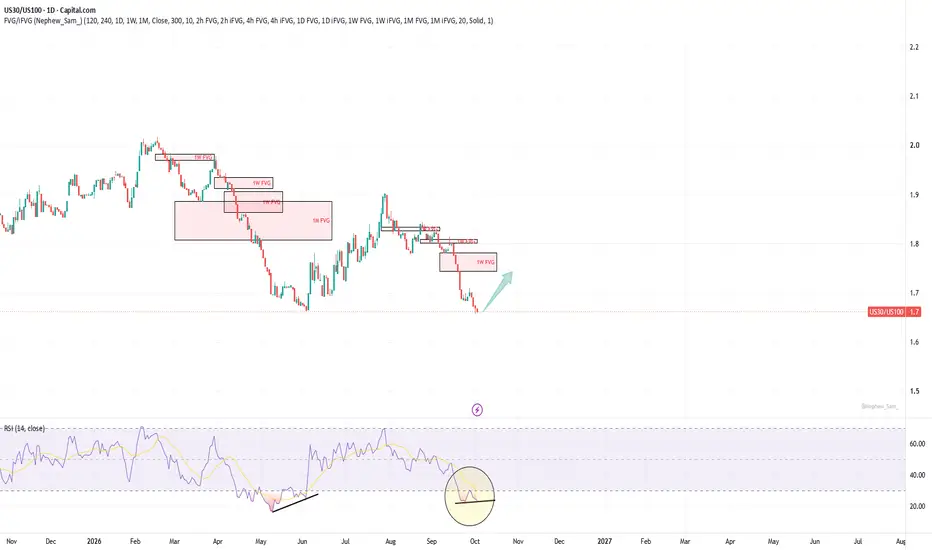
The daily positive divergence is not just on DJI and US30 charts but also on US30/US100 and DJI/NDX charts. This means if it will be confirmed Dow Jones may outperform nasdaq for some time.
註釋
There is also a developing weekly divergence on US30 divided by US100 chart. When Nasdaq underperforms Dow Jones indices usually decline. We might see a deep correction on all indices soon.取消訂單
Daily divergence was invalidated today. Need to wait for a new one.註釋
Well, it worked anyway. Looks like RSI length = 7 works better for this chart.
免責聲明
這些資訊和出版物並非旨在提供,也不構成TradingView提供或認可的任何形式的財務、投資、交易或其他類型的建議或推薦。請閱讀使用條款以了解更多資訊。
免責聲明
這些資訊和出版物並非旨在提供,也不構成TradingView提供或認可的任何形式的財務、投資、交易或其他類型的建議或推薦。請閱讀使用條款以了解更多資訊。