
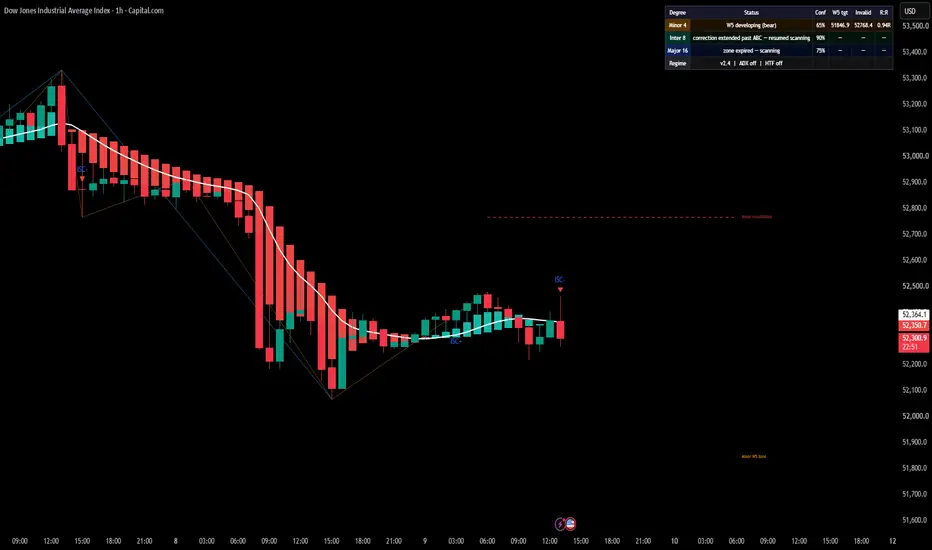
The Elliott Wave indicator is currently showcasing a bearish structure on US30, with price trading below the key invalidation zone highlighted on the chart.
The candle state has also shifted bearish, confirming a weaker short-term structure and increasing the probability of continuation to the downside.
As long as price remains below the highlighted invalidation level, the bearish count remains active, and a new bearish leg could develop from here.
A break back above invalidation would weaken the current bearish scenario and force a reassessment of the wave structure.
Current bias: Bearish while below invalidation.
Scenario: Potential continuation into a new downside leg.
Invalidation: Highlighted level above price.
The candle state has also shifted bearish, confirming a weaker short-term structure and increasing the probability of continuation to the downside.
As long as price remains below the highlighted invalidation level, the bearish count remains active, and a new bearish leg could develop from here.
A break back above invalidation would weaken the current bearish scenario and force a reassessment of the wave structure.
Current bias: Bearish while below invalidation.
Scenario: Potential continuation into a new downside leg.
Invalidation: Highlighted level above price.

免責聲明
這些資訊和出版物並非旨在提供,也不構成TradingView提供或認可的任何形式的財務、投資、交易或其他類型的建議或推薦。請閱讀使用條款以了解更多資訊。
免責聲明
這些資訊和出版物並非旨在提供,也不構成TradingView提供或認可的任何形式的財務、投資、交易或其他類型的建議或推薦。請閱讀使用條款以了解更多資訊。