做空
SPX Weekly Technical Analysis
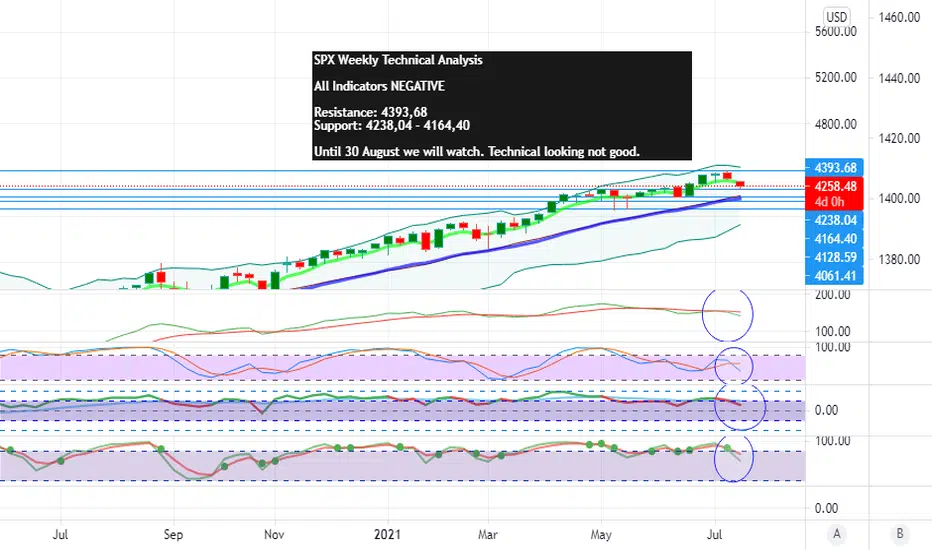
SPX Weekly Technical Analysis
All Indicators NEGATIVE
Resistance: 4393,68
Support: 4238,04 - 4164,40
Until 30 August we will watch. Technical looking not good.
All Indicators NEGATIVE
Resistance: 4393,68
Support: 4238,04 - 4164,40
Until 30 August we will watch. Technical looking not good.
交易結束:達到停損點
There is positive developments from the USA and CHINA. our analysis was NEGATIVE. Indicators are also moved in the positive direction with this good news. In this fast rising indicators, we are closing early our analysis without waiting 30 augustOpen Analysis Price: 4258,48
Closed Analysis Price: 4401,51
Diffirence: % -3,36

免責聲明
這些資訊和出版物並非旨在提供,也不構成TradingView提供或認可的任何形式的財務、投資、交易或其他類型的建議或推薦。請閱讀使用條款以了解更多資訊。
免責聲明
這些資訊和出版物並非旨在提供,也不構成TradingView提供或認可的任何形式的財務、投資、交易或其他類型的建議或推薦。請閱讀使用條款以了解更多資訊。