SPX - 1D
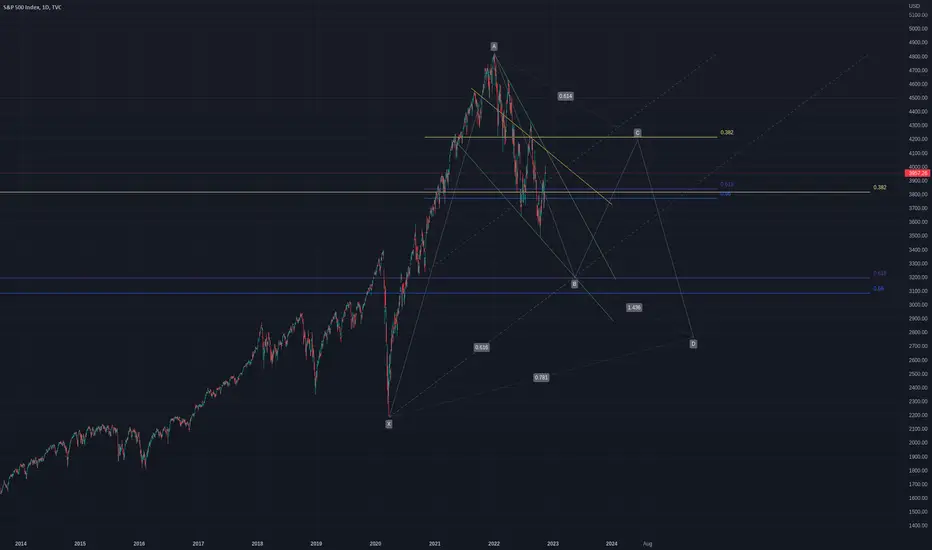
Green - Falling wedge resistance steeper than support
Yellow 0.382 fib resistance levels from swing lows (left) to high (right)
Blue/Purple 0.618 fib retracement levels for possible areas of support ( * would be good to include weekly, monthly and/or daily supports for confluence, but would crowd the chart)
Yellow diagonal possible resistance - breaks Green falling wedge (actually not sure why thats there, I think should we break above 0.382 would serve as possible resistance, 0.618 support, hmm)
Grey - Possible gartley harmonic - big time frame accuracy based on macro less probable
Grey dash - fib markers

免責聲明
這些資訊和出版物並非旨在提供,也不構成TradingView提供或認可的任何形式的財務、投資、交易或其他類型的建議或推薦。請閱讀使用條款以了解更多資訊。