做空
Short S&P 500
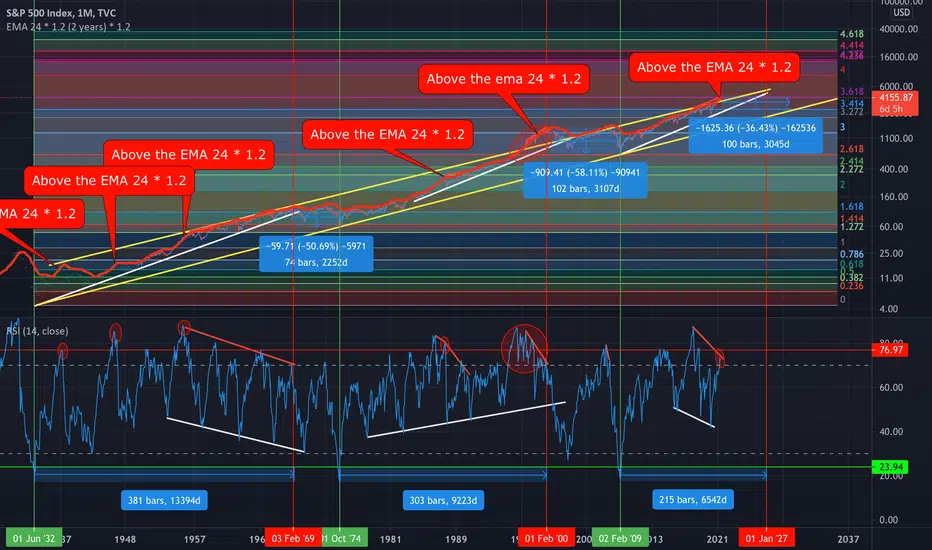
Hello everyone, one of my best analyzes. We are near the end of a cycle, it should end before 2027. The fibonacci retracement follows the crash of 1929, which is also the start of the uptrend. We can see that we have only exited the yellow channel twice. Once from 1997 to 2001 and again from December 2020 to today. The bullish trends inside the bullish channel end when the white support line is broken. The second bullish base lasts about 70% of the time of the first, if we project that the third bullish base should last around 6500 days. When we have been above the 2 years * 1.2 EMA there has been a decline each time, we are currently above that moving average. The RSI: We can see that every time we hit or cross the 77, it follows a decline. Crashes are preceded by a bearish divergence, there is currently an unconfirmed bearish divergence. The crashes lasted 2250 days and 3100 days, each time we returned to the previous level of fibonacci and the channel support. If this is repeated we can expect a drop of more than 35% from the current level.

免責聲明
這些資訊和出版物並非旨在提供,也不構成TradingView提供或認可的任何形式的財務、投資、交易或其他類型的建議或推薦。請閱讀使用條款以了解更多資訊。
免責聲明
這些資訊和出版物並非旨在提供,也不構成TradingView提供或認可的任何形式的財務、投資、交易或其他類型的建議或推薦。請閱讀使用條款以了解更多資訊。