
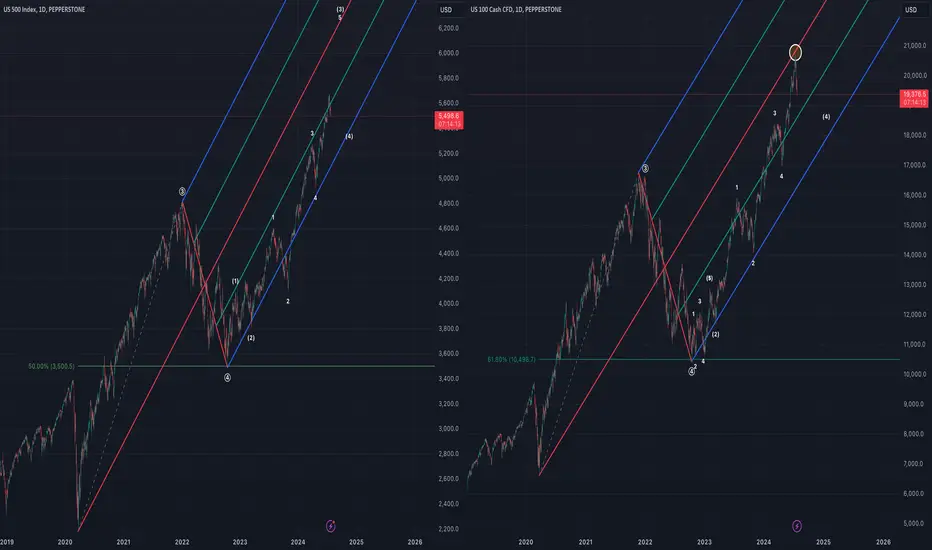
Comparing bullish counts for US500 and NAS100, as they seem to be at similar points in their primary wave structures. I have both charts in wave 5 of (3) of ((5)).
As of right now, I'm relying more on US30 and US2000, in terms of further rallies before wave 5 is near completion.
NAS100 came very close (but did not officially tag) to its pitchfork median line, which may explain the profit taking and ~7% price drop since ATH.
I do think that US500 will eventually tag its pitchfork median line as well, more likely in 2025.
As of right now, I'm relying more on US30 and US2000, in terms of further rallies before wave 5 is near completion.
NAS100 came very close (but did not officially tag) to its pitchfork median line, which may explain the profit taking and ~7% price drop since ATH.
I do think that US500 will eventually tag its pitchfork median line as well, more likely in 2025.

免責聲明
這些資訊和出版物並非旨在提供,也不構成TradingView提供或認可的任何形式的財務、投資、交易或其他類型的建議或推薦。請閱讀使用條款以了解更多資訊。
免責聲明
這些資訊和出版物並非旨在提供,也不構成TradingView提供或認可的任何形式的財務、投資、交易或其他類型的建議或推薦。請閱讀使用條款以了解更多資訊。