做空
SP500 Forecast
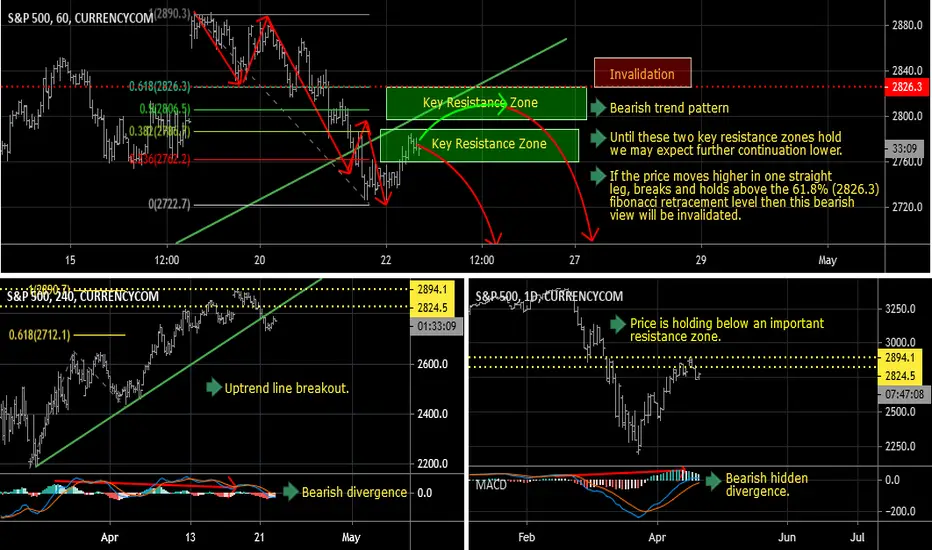
D1 - Price respected an important resistance zone and is holding below it, bearish hidden divergence.
H4 - Price has broken below the most recent uptrend line, bearish divergence.
H1 - Bearish trend pattern, until the two key resistance zones shown in the chart holds my view remains bearish here.
If the price moves higher in one straight leg, breaks and holds above the 61.8% (2826.3) fibonacci retracement level then this bearish view will be invalidated.
H4 - Price has broken below the most recent uptrend line, bearish divergence.
H1 - Bearish trend pattern, until the two key resistance zones shown in the chart holds my view remains bearish here.
If the price moves higher in one straight leg, breaks and holds above the 61.8% (2826.3) fibonacci retracement level then this bearish view will be invalidated.

免責聲明
這些資訊和出版物並非旨在提供,也不構成TradingView提供或認可的任何形式的財務、投資、交易或其他類型的建議或推薦。請閱讀使用條款以了解更多資訊。
免責聲明
這些資訊和出版物並非旨在提供,也不構成TradingView提供或認可的任何形式的財務、投資、交易或其他類型的建議或推薦。請閱讀使用條款以了解更多資訊。