已更新
SPX & MACD Relationshipe
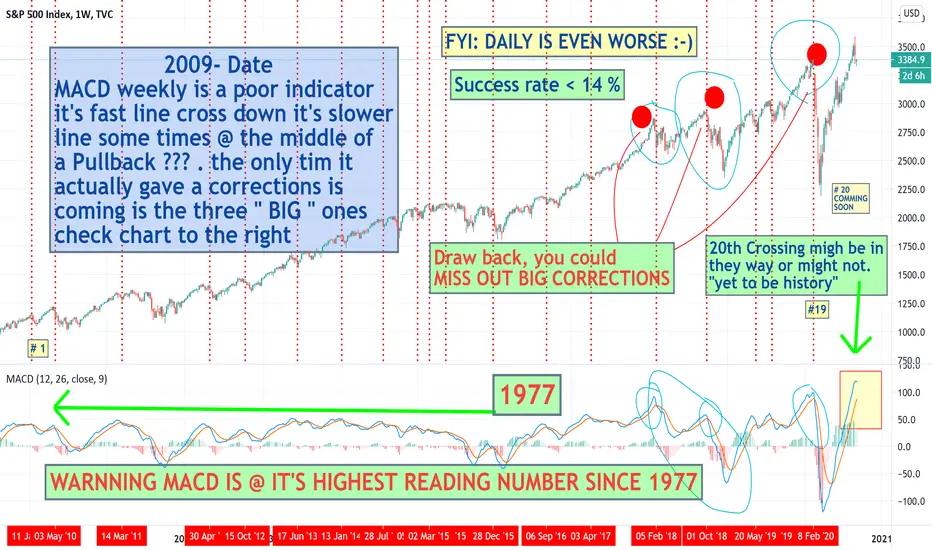
on a weekly chart success rate is less than 14 %, but you could miss out big corrections which happens to be
the big three since 2009 check chart for more info.
. wish all the best.
the big three since 2009 check chart for more info.
. wish all the best.
註釋
MACD'S face, weekly, is starting to point downward with the highest reading since 1977. Remember that it has 14 % success rate within the time frame of the study.wish you all the best.
註釋
CROSSING UP-WARD****************************************
Hello guys,
This is a continuation of our examination of MACD. I did a quick study for the
two lines crossing up ward since 1950s (i might missed allot:-) ). So, opposite of the above study, with monthly we got 62 % success rate. But with weekly it is disappointing !.
When the lines crosses up we got:
63 crossing @ TOPS !!!
49 crossing @ up swings
12@ Sideways !!!
SUMMERY:
40 % success rate BIG DISAPPOINTMENT
50 % False signals Also a big #
10 % neutral
SO 60 % OF THE TIME YOU WOULD LOSS MONEY !!!.
wish you the best.

I do more in depth studies of stocks on my twitter account. Hope you would enjoy it there as you are enjoying it here.
****** Past performance is no guarantee of future results***
twitter.com/samitrading1
****** Past performance is no guarantee of future results***
twitter.com/samitrading1
免責聲明
這些資訊和出版物並非旨在提供,也不構成TradingView提供或認可的任何形式的財務、投資、交易或其他類型的建議或推薦。請閱讀使用條款以了解更多資訊。
I do more in depth studies of stocks on my twitter account. Hope you would enjoy it there as you are enjoying it here.
****** Past performance is no guarantee of future results***
twitter.com/samitrading1
****** Past performance is no guarantee of future results***
twitter.com/samitrading1
免責聲明
這些資訊和出版物並非旨在提供,也不構成TradingView提供或認可的任何形式的財務、投資、交易或其他類型的建議或推薦。請閱讀使用條款以了解更多資訊。