
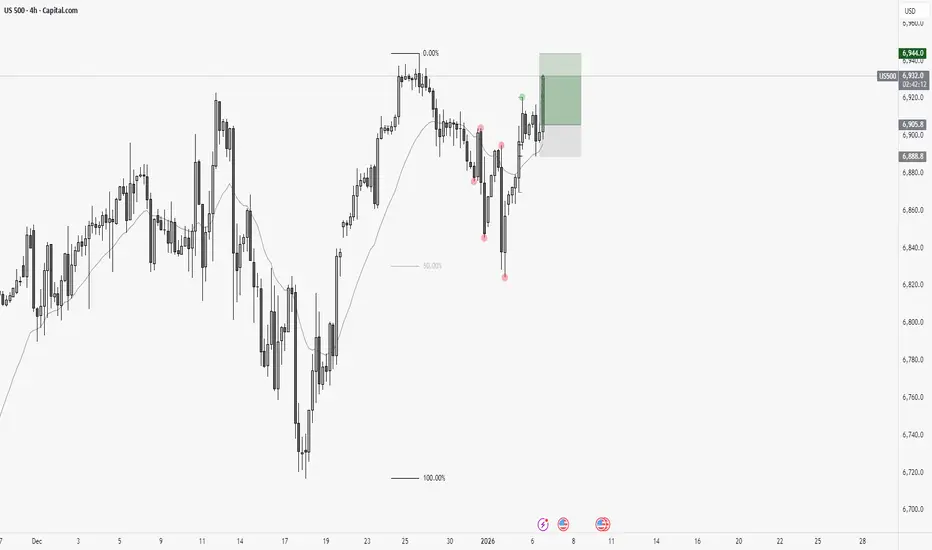
Not forgetting that it is an asset that constantly renews historical highs, through pullbacks in the daily average before these events, the asset began this pullback in the last week of the year.
After retesting the daily ema, at a price level coinciding with the 50% Fibonacci (discount zone), there was a clear bullishreaction, aligning the 4H timeframe fractal and placing the price above the respective 4H ema.
This movement also aligned the 1H timeframe in fractal terms.
Entry:
The entry came after the 4H ema retest, coinciding with the 50% Fibonacci level of 1H, with the trigger coming when the price broke above the 1H ema.
After retesting the daily ema, at a price level coinciding with the 50% Fibonacci (discount zone), there was a clear bullishreaction, aligning the 4H timeframe fractal and placing the price above the respective 4H ema.
This movement also aligned the 1H timeframe in fractal terms.
Entry:
The entry came after the 4H ema retest, coinciding with the 50% Fibonacci level of 1H, with the trigger coming when the price broke above the 1H ema.

免責聲明
這些資訊和出版物並非旨在提供,也不構成TradingView提供或認可的任何形式的財務、投資、交易或其他類型的建議或推薦。請閱讀使用條款以了解更多資訊。
免責聲明
這些資訊和出版物並非旨在提供,也不構成TradingView提供或認可的任何形式的財務、投資、交易或其他類型的建議或推薦。請閱讀使用條款以了解更多資訊。