S&P 500 Index ( US500) Daily: Accelerating Fan Structure Eyes Major Target Zone Near 7,900
### 🇺🇸 USA S&P 500 Index (US500) Daily Technical Framework (Ref: US500_2026-07-22_09-49-42.png)
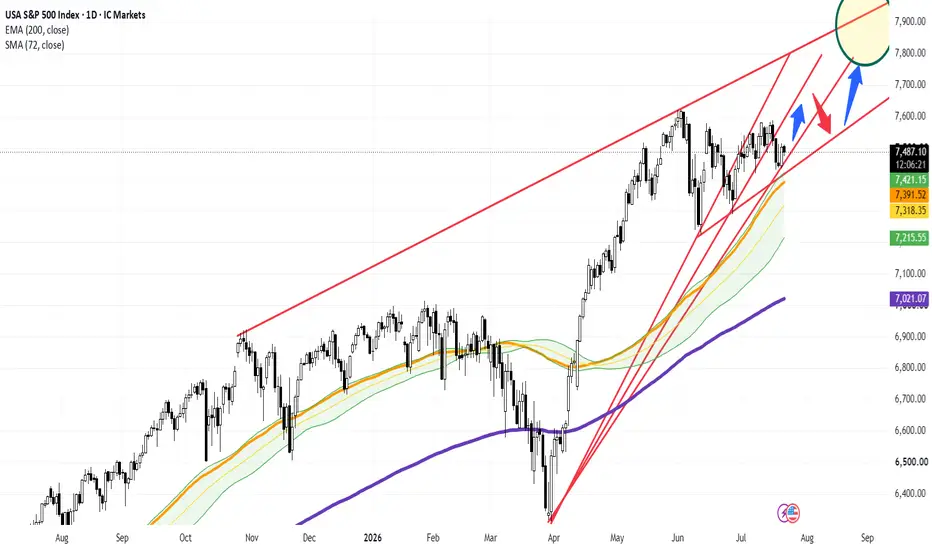
We are deploying a multi-week structural technical outlook on the USA S&P 500 Index (US500) tracking the Daily (1D) interval. The broad market benchmark continues to trade within an aggressive, expanding bullish fan geometry, respecting dynamic trendline boundaries and institutional moving average ribbons.
The index is experiencing a minor consolidation today, trading slightly down at **7,485.90 (-0.24%)**, testing immediate dynamic support.
---
### 🔍 Technical Architecture & Dynamic Fan Geometry:
Our quantitative framework highlights a highly structured trend-continuation environment:
1. **The Ascending Trendline Fan Matrix:** The price action from the April lows is governed by a series of ascending trendlines (red diagonal LTAs). The index is currently compressing near the median boundary of this bullish structure.
2. **Dynamic Moving Average Cushion:** Immediately below current price action sits the protective **72-period SMA ribbon cluster (tracked between 7,318.35 and 7,421.15)**. This band serves as a dynamic demand filter during market pullbacks.
3. **Institutional Bullish Foundation:** The primary trend health remains firmly bullish, sustained well above the ascending **200-period EMA (purple line sitting at 7,021.06)**.
---
### 🚀 Projected Structural Pathways toward 7,900 Target Zone:
We are mapping two potential technical routes (represented by our blue and red tracking vectors) leading to the primary upper target zone marked inside the highlighted yellow circle near **7,800 – 7,900**:
#### 🟦 Route 1: Direct Impulse Expansion (First Blue Vector)
* **The Play:** Immediate buy-side defense at the current **7,485.90** support level triggers a direct momentum push through local resistance, driving price straight toward the upper channel wall near **7,800.00+**.
#### 🟥/🟦 Route 2: Support Retest & Rebound (Red Vector into Second Blue Vector)
* **The Play:** A localized shallow dip (red vector) back to test the confluence of the lower ascending support trendline and the **72-SMA cluster near 7,391.50 – 7,421.15**.
* **The Target:** Buyers absorb the pullback at this dynamic node, initiating a secondary impulse wave (second blue vector) targeting the upper structural ceiling in the **7,850.00 – 7,900.00** corridor.
### 📊 Tactical Parameters Summary:
* **Current Bias:** Strongly Bullish (Trend Acceleration)
* **Immediate Dynamic Support:** 7,421.15 (72-SMA Boundary)
* **Secondary Structural Floor:** 7,318.35
* **Macro Profit Target Zone:** 7,800.00 – 7,900.00 (Upper Channel Resistance)
---
📊 **ChartPro Data**
*US Equity Architecture, Structural Fan Geometry & Systematic Risk Management.*
⚠️ **Disclaimer:** For educational and informational purposes only. This active market study represents a personal trading framework and does not constitute financial or investment advice.
US500) Daily: Accelerating Fan Structure Eyes Major Target Zone Near 7,900### 🇺🇸 USA S&P 500 Index (
US500) Daily Technical Framework (Ref: US500_2026-07-22_09-49-42.png)We are deploying a multi-week structural technical outlook on the USA S&P 500 Index (
US500) tracking the Daily (1D) interval. The broad market benchmark continues to trade within an aggressive, expanding bullish fan geometry, respecting dynamic trendline boundaries and institutional moving average ribbons.The index is experiencing a minor consolidation today, trading slightly down at **7,485.90 (-0.24%)**, testing immediate dynamic support.
---
### 🔍 Technical Architecture & Dynamic Fan Geometry:
Our quantitative framework highlights a highly structured trend-continuation environment:
1. **The Ascending Trendline Fan Matrix:** The price action from the April lows is governed by a series of ascending trendlines (red diagonal LTAs). The index is currently compressing near the median boundary of this bullish structure.
2. **Dynamic Moving Average Cushion:** Immediately below current price action sits the protective **72-period SMA ribbon cluster (tracked between 7,318.35 and 7,421.15)**. This band serves as a dynamic demand filter during market pullbacks.
3. **Institutional Bullish Foundation:** The primary trend health remains firmly bullish, sustained well above the ascending **200-period EMA (purple line sitting at 7,021.06)**.
---
### 🚀 Projected Structural Pathways toward 7,900 Target Zone:
We are mapping two potential technical routes (represented by our blue and red tracking vectors) leading to the primary upper target zone marked inside the highlighted yellow circle near **7,800 – 7,900**:
#### 🟦 Route 1: Direct Impulse Expansion (First Blue Vector)
* **The Play:** Immediate buy-side defense at the current **7,485.90** support level triggers a direct momentum push through local resistance, driving price straight toward the upper channel wall near **7,800.00+**.
#### 🟥/🟦 Route 2: Support Retest & Rebound (Red Vector into Second Blue Vector)
* **The Play:** A localized shallow dip (red vector) back to test the confluence of the lower ascending support trendline and the **72-SMA cluster near 7,391.50 – 7,421.15**.
* **The Target:** Buyers absorb the pullback at this dynamic node, initiating a secondary impulse wave (second blue vector) targeting the upper structural ceiling in the **7,850.00 – 7,900.00** corridor.
### 📊 Tactical Parameters Summary:
* **Current Bias:** Strongly Bullish (Trend Acceleration)
* **Immediate Dynamic Support:** 7,421.15 (72-SMA Boundary)
* **Secondary Structural Floor:** 7,318.35
* **Macro Profit Target Zone:** 7,800.00 – 7,900.00 (Upper Channel Resistance)
---
📊 **ChartPro Data**
*US Equity Architecture, Structural Fan Geometry & Systematic Risk Management.*
⚠️ **Disclaimer:** For educational and informational purposes only. This active market study represents a personal trading framework and does not constitute financial or investment advice.

免責聲明
這些資訊和出版物並非旨在提供,也不構成TradingView提供或認可的任何形式的財務、投資、交易或其他類型的建議或推薦。請閱讀使用條款以了解更多資訊。
免責聲明
這些資訊和出版物並非旨在提供,也不構成TradingView提供或認可的任何形式的財務、投資、交易或其他類型的建議或推薦。請閱讀使用條款以了解更多資訊。