

Hi, new trader here. I'm trading on a naked chart
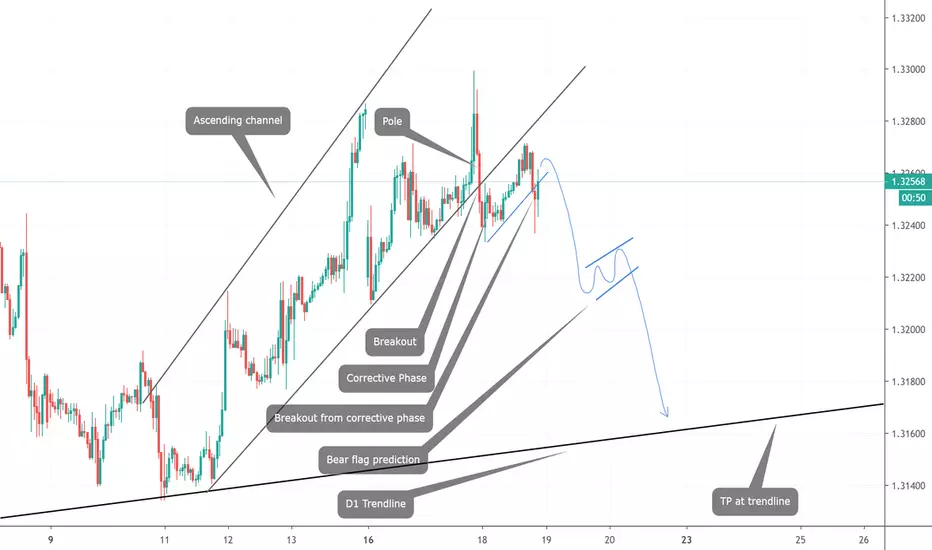
I've analysed USDCAD heading for a downtrend. It has broken off the ascending channel and formed a corrective phase.
From the figure above, it has broken off the corrective phase and could potentially go for a downtrend.
I've set a potential TP point when it touches the trendline on the higher timeframe.
Any comments and opinions please comment below. Thank you :)

免責聲明
這些資訊和出版物並非旨在提供,也不構成TradingView提供或認可的任何形式的財務、投資、交易或其他類型的建議或推薦。請閱讀使用條款以了解更多資訊。