

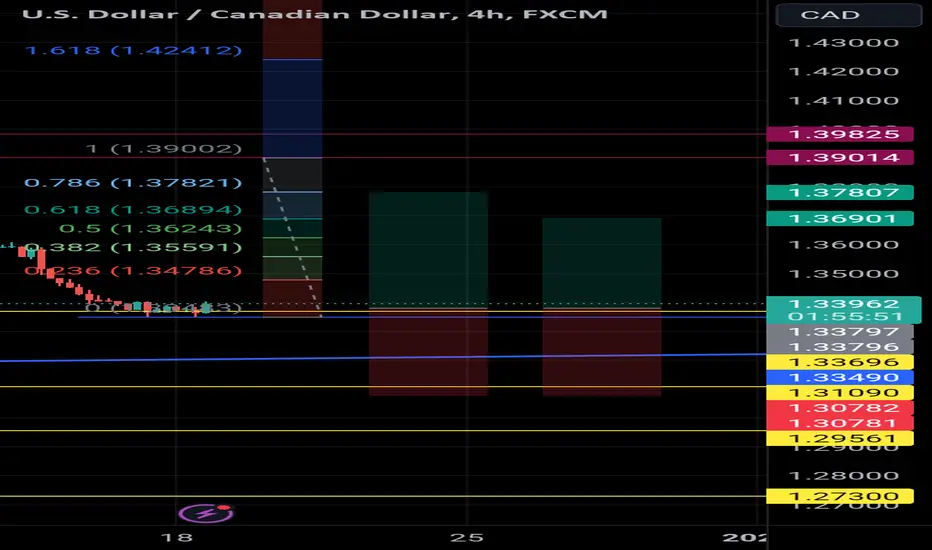
A #long trade opportunity recently presented itself on the #dollarloonie (#USDCAD) #trading chart 📈.
This is indicated by the #bullish harami candlestick 🕯️ pattern on the 1.33696 horizontal support level.
This indicates a fakeout of the same level, with potential price move in the upward 👆 ⬆️ direction (#buy).
Sufficient upward momentum should see price rallying towards the 1.38000 psychological level and possibly testing the strength of the 1.39014 horizontal resistance level.
As always, please apply appropriate risk management.
Happy trading!
#majorpair
This is indicated by the #bullish harami candlestick 🕯️ pattern on the 1.33696 horizontal support level.
This indicates a fakeout of the same level, with potential price move in the upward 👆 ⬆️ direction (#buy).
Sufficient upward momentum should see price rallying towards the 1.38000 psychological level and possibly testing the strength of the 1.39014 horizontal resistance level.
As always, please apply appropriate risk management.
Happy trading!
#majorpair

免責聲明
這些資訊和出版物並非旨在提供,也不構成TradingView提供或認可的任何形式的財務、投資、交易或其他類型的建議或推薦。請閱讀使用條款以了解更多資訊。
免責聲明
這些資訊和出版物並非旨在提供,也不構成TradingView提供或認可的任何形式的財務、投資、交易或其他類型的建議或推薦。請閱讀使用條款以了解更多資訊。