

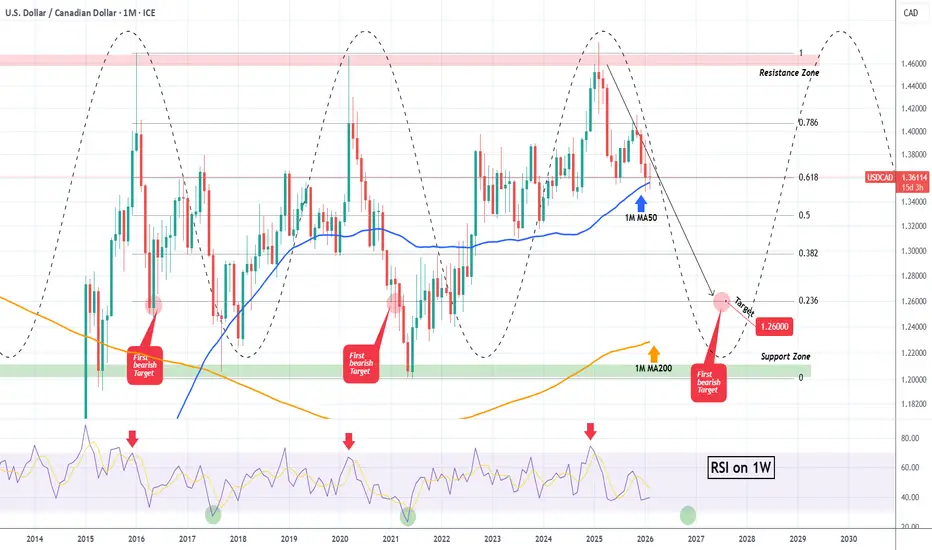
The USDCAD pair hit last month its 1M MA50 (blue trend-line) for the first time since the September 2022 bullish break-out. That trend-line has technically been the pivot that separated the Bull from the Bear Cycles in the past years.
The pair has been on a macro consolidation within a wide range for almost 11 years (since May 2015). Every touch on its Resistance Zone has been a massive long-term sell opportunity and equally a buy opportunity on its Support Zone. Last time the market hit the Resistance Zone was exactly 1 year ago (February 2025) and we gave a huge Sell Signal.
So if the price closes a 1M candle below the 1M MA50, we will take it as a bearish continuation signal, targeting the 0.236 Fibonacci level at 1.26000. This will still be slightly above the 1M MA200 (orange trend-line), which has been untouched since June 2015 and is the next macro Support level of interest.
Note that every time the 1W RSI broke below its 30.00 oversold barrier, it coincided with the price hitting its long-term Support Zone, thus being a massive buy opportunity.
---
** Please LIKE 👍, FOLLOW ✅, SHARE 🙌 and COMMENT ✍ if you enjoy this idea! Also share your ideas and charts in the comments section below! This is best way to keep it relevant, support us, keep the content here free and allow the idea to reach as many people as possible. **
---
💸💸💸💸💸💸
👇 👇 👇 👇 👇 👇
The pair has been on a macro consolidation within a wide range for almost 11 years (since May 2015). Every touch on its Resistance Zone has been a massive long-term sell opportunity and equally a buy opportunity on its Support Zone. Last time the market hit the Resistance Zone was exactly 1 year ago (February 2025) and we gave a huge Sell Signal.
So if the price closes a 1M candle below the 1M MA50, we will take it as a bearish continuation signal, targeting the 0.236 Fibonacci level at 1.26000. This will still be slightly above the 1M MA200 (orange trend-line), which has been untouched since June 2015 and is the next macro Support level of interest.
Note that every time the 1W RSI broke below its 30.00 oversold barrier, it coincided with the price hitting its long-term Support Zone, thus being a massive buy opportunity.
---
** Please LIKE 👍, FOLLOW ✅, SHARE 🙌 and COMMENT ✍ if you enjoy this idea! Also share your ideas and charts in the comments section below! This is best way to keep it relevant, support us, keep the content here free and allow the idea to reach as many people as possible. **
---
💸💸💸💸💸💸
👇 👇 👇 👇 👇 👇

I trade Crypto, Forex, Indices & Commodities on PrimeXBT — all from one account with TradingView charts 👉 tradingshot.short.gy/PrimeXBT
I also use TradeNation for fixed spreads & zero commission 👉 tradingshot.short.gy/Tradenation
I also use TradeNation for fixed spreads & zero commission 👉 tradingshot.short.gy/Tradenation
免責聲明
這些資訊和出版物並非旨在提供,也不構成TradingView提供或認可的任何形式的財務、投資、交易或其他類型的建議或推薦。請閱讀使用條款以了解更多資訊。
I trade Crypto, Forex, Indices & Commodities on PrimeXBT — all from one account with TradingView charts 👉 tradingshot.short.gy/PrimeXBT
I also use TradeNation for fixed spreads & zero commission 👉 tradingshot.short.gy/Tradenation
I also use TradeNation for fixed spreads & zero commission 👉 tradingshot.short.gy/Tradenation
免責聲明
這些資訊和出版物並非旨在提供,也不構成TradingView提供或認可的任何形式的財務、投資、交易或其他類型的建議或推薦。請閱讀使用條款以了解更多資訊。