

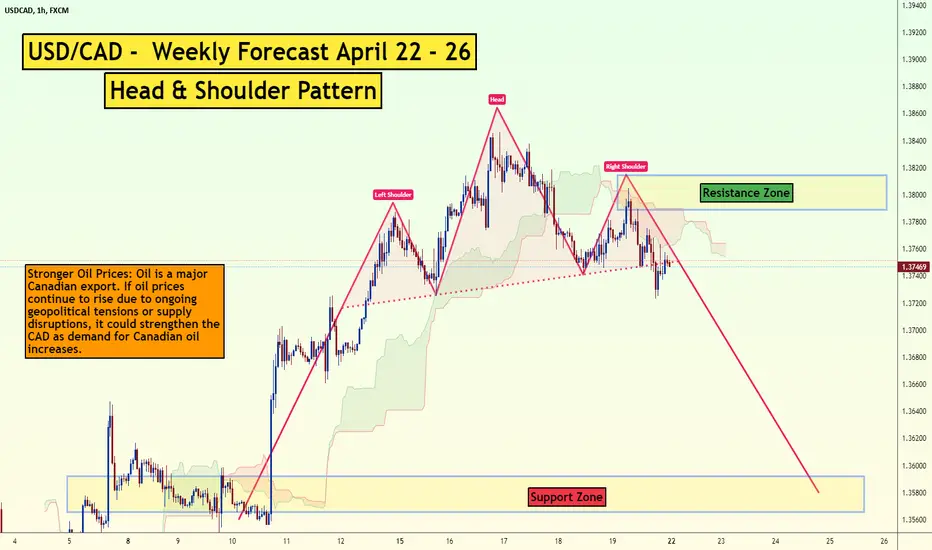
USD/CAD H1 Chart - Potential Short Entry Based on Head and Shoulders Pattern
The USD/CAD H1 chart might be presenting a shorting opportunity based on a possible Head and Shoulders pattern.
Pattern: Head and Shoulders (Bearish Reversal)
Description:
This pattern consists of three peaks: a left shoulder, a higher middle peak (head), and a right shoulder that is lower than the head.
A neckline is drawn connecting the swing lows before the left shoulder and the right shoulder.
If the price dips below the neckline (support level), it could signal a potential sell entry.
Profit Targets: Potential profit targets can be based on the height of the head (measured from the head to the neckline) projected downwards from the breakdown point. Technical indicators can also be used for profit targets.
Thank you.
註釋
Stronger Oil Prices: Oil is a major Canadian export. If oil prices continue to rise due to ongoing geopolitical tensions or supply disruptions, it could strengthen the CAD as demand for Canadian oil increases.交易進行
註釋

🟢Telegram Channel : telegram.me/kabhi_official
🟢WhatsApp Channel :whatsapp.com/channel/0029Va5F10Q5q08a0IGSsC0P
Contact Me @
Telegram - telegram.me/kabhidhan_official
🟢WhatsApp Channel :whatsapp.com/channel/0029Va5F10Q5q08a0IGSsC0P
Contact Me @
Telegram - telegram.me/kabhidhan_official
相關出版品
免責聲明
這些資訊和出版物並非旨在提供,也不構成TradingView提供或認可的任何形式的財務、投資、交易或其他類型的建議或推薦。請閱讀使用條款以了解更多資訊。