

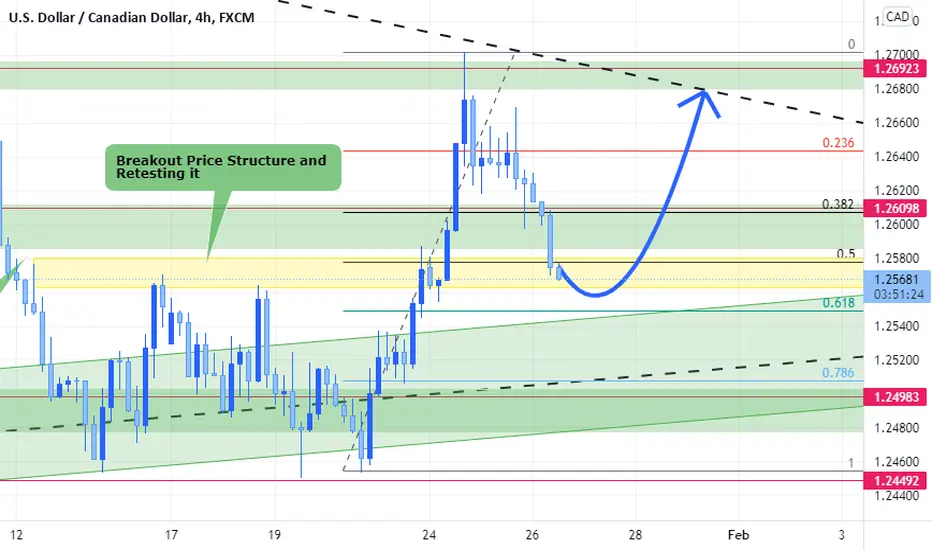
This pair is going bullish for now
Technical Analysis
1-Break out price structure and retesting it before continuation to the upside
2-Ascending Triangle Chart Pattern on weekly Time Frame
*Sentimental Analysis:
1-CADJPY Reached falling resistance level indicating bearish move for the pair (Indicating possible weakness for the CAD)

2-AUDCAD is making Q&M chart Pattern which is indication of bullish move for the pair(Indicating possible weakness for the CAD)

Technical Analysis
1-Break out price structure and retesting it before continuation to the upside
2-Ascending Triangle Chart Pattern on weekly Time Frame
*Sentimental Analysis:
1-CADJPY Reached falling resistance level indicating bearish move for the pair (Indicating possible weakness for the CAD)
2-AUDCAD is making Q&M chart Pattern which is indication of bullish move for the pair(Indicating possible weakness for the CAD)
交易結束:目標達成

免責聲明
這些資訊和出版物並非旨在提供,也不構成TradingView提供或認可的任何形式的財務、投資、交易或其他類型的建議或推薦。請閱讀使用條款以了解更多資訊。
免責聲明
這些資訊和出版物並非旨在提供,也不構成TradingView提供或認可的任何形式的財務、投資、交易或其他類型的建議或推薦。請閱讀使用條款以了解更多資訊。