

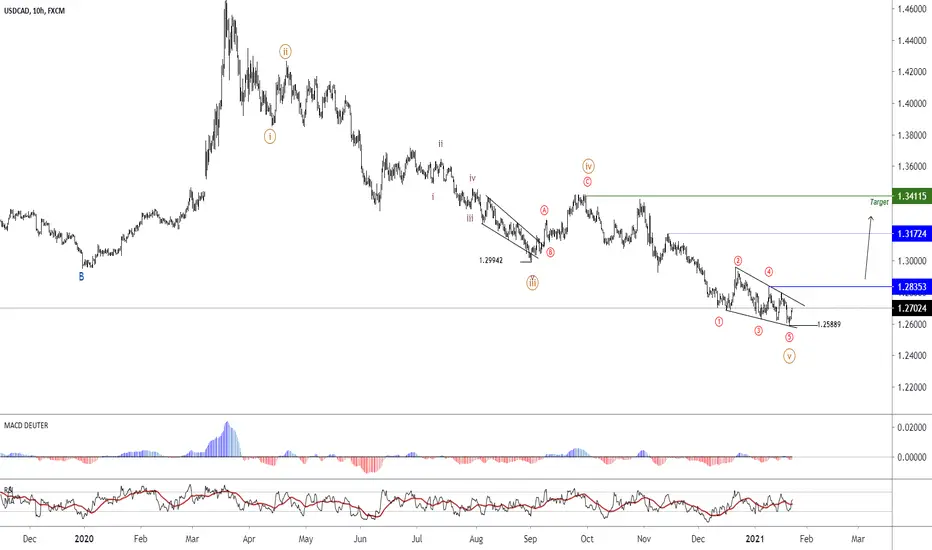
In some cases, we cannot detect the main trend clearly. But there are patterns that are helpful, they temporarily show the trend. One of these patterns is Diagonal.
As you can see in the image, the Diagonal pattern is formed and we are waiting for the price to increase to the range of 1. 3411. To get the confirmation for the uptrend, the price should cross the range of 1.2835.
In addition, convergence is evident in RSI. This analysis will be violated by crossing the price from the range of 1.2588.
As you can see in the image, the Diagonal pattern is formed and we are waiting for the price to increase to the range of 1. 3411. To get the confirmation for the uptrend, the price should cross the range of 1.2835.
In addition, convergence is evident in RSI. This analysis will be violated by crossing the price from the range of 1.2588.

免責聲明
這些資訊和出版物並非旨在提供,也不構成TradingView提供或認可的任何形式的財務、投資、交易或其他類型的建議或推薦。請閱讀使用條款以了解更多資訊。